

Are you the author? Sign in to claim
A comprehensive observability solution for monitoring Claude Code usage, performance, and costs.


A comprehensive observability solution for monitoring Claude Code usage, performance, and costs. This setup implements the recommendations from the Claude Code Observability Documentation to provide deep insights into AI-assisted development workflows.
Track spending across different Claude models with detailed breakdowns of costs, API requests, and token usage patterns.
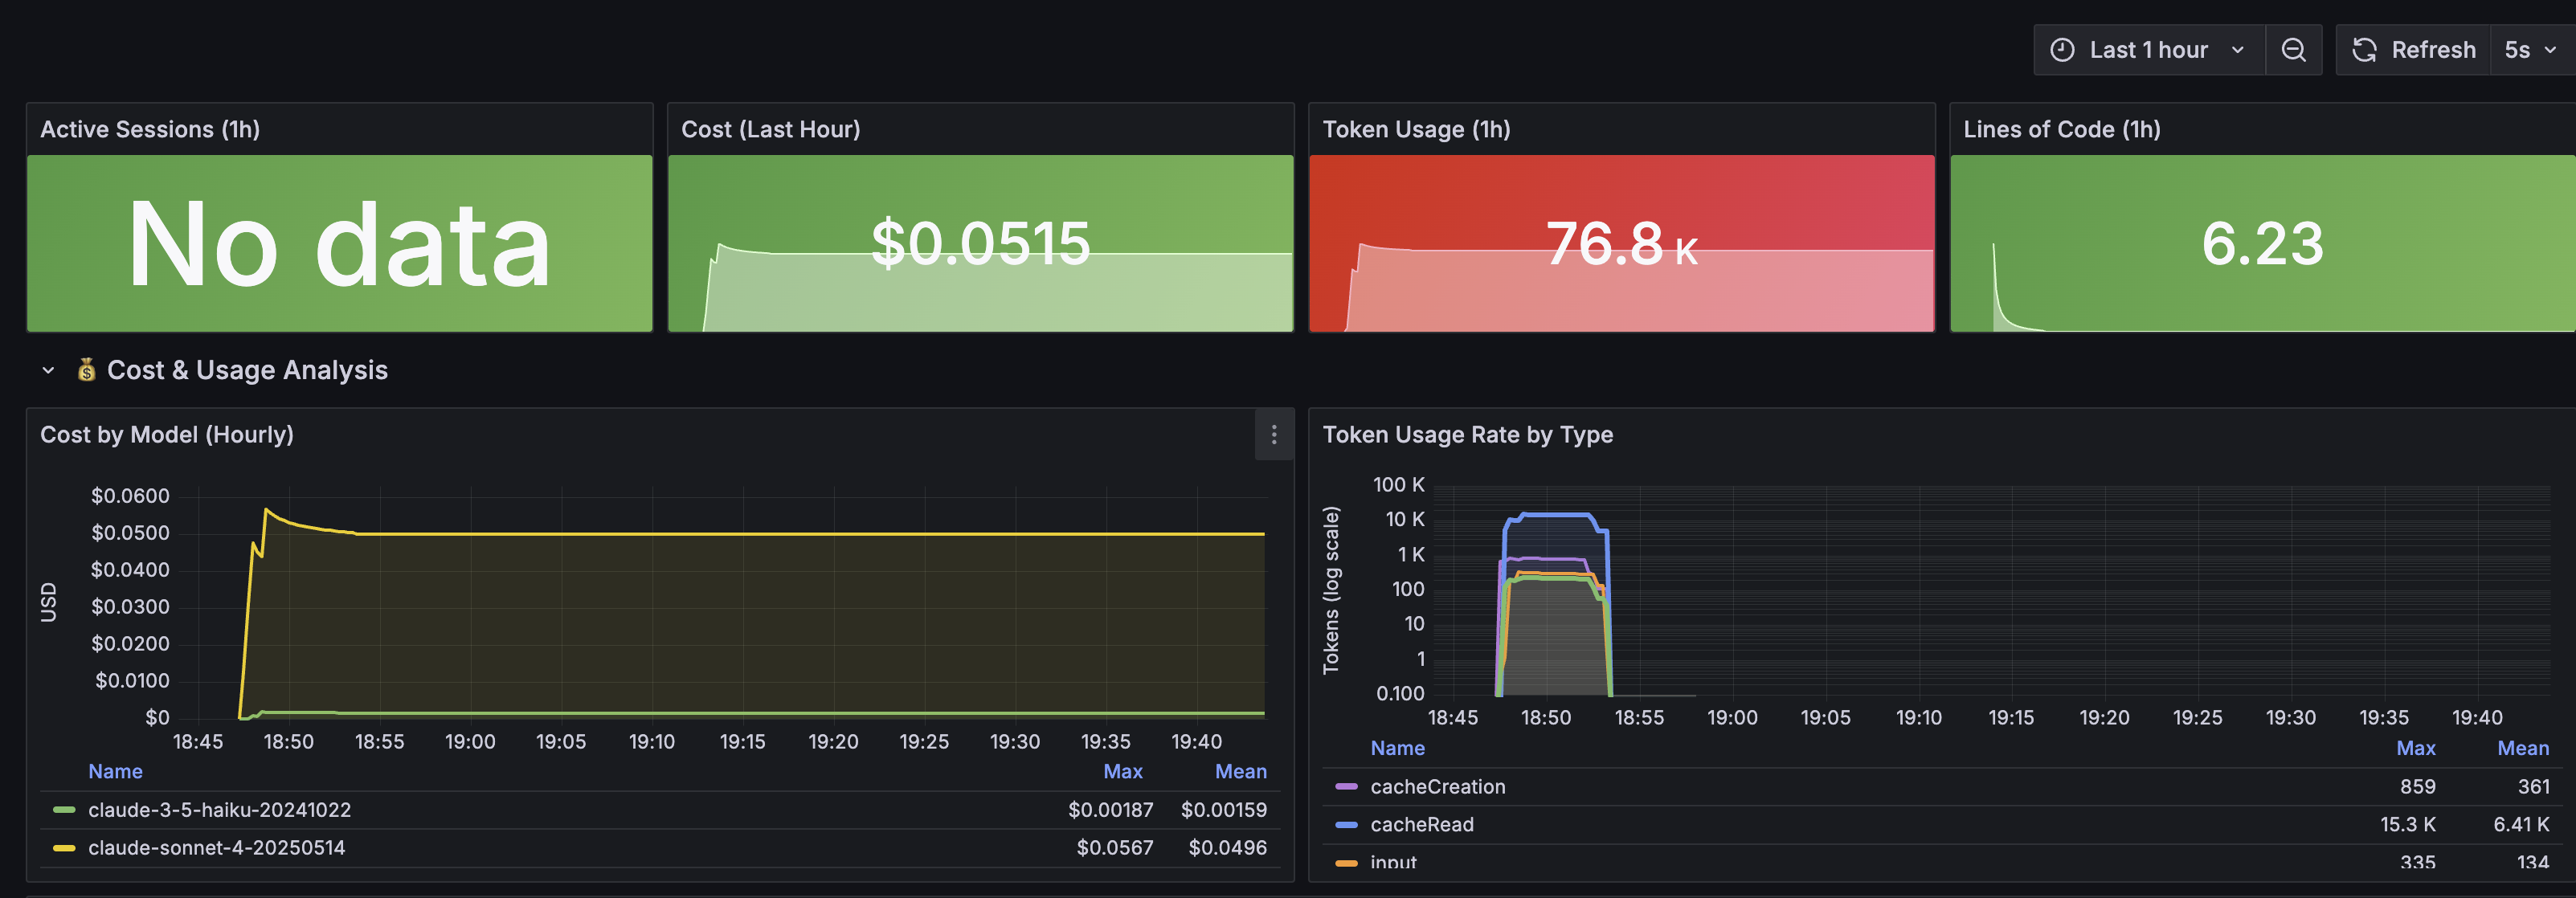
Features: Model cost comparison, API request tracking, token usage breakdown by type
Monitor development productivity with comprehensive session analytics, tool usage patterns, and code change metrics.
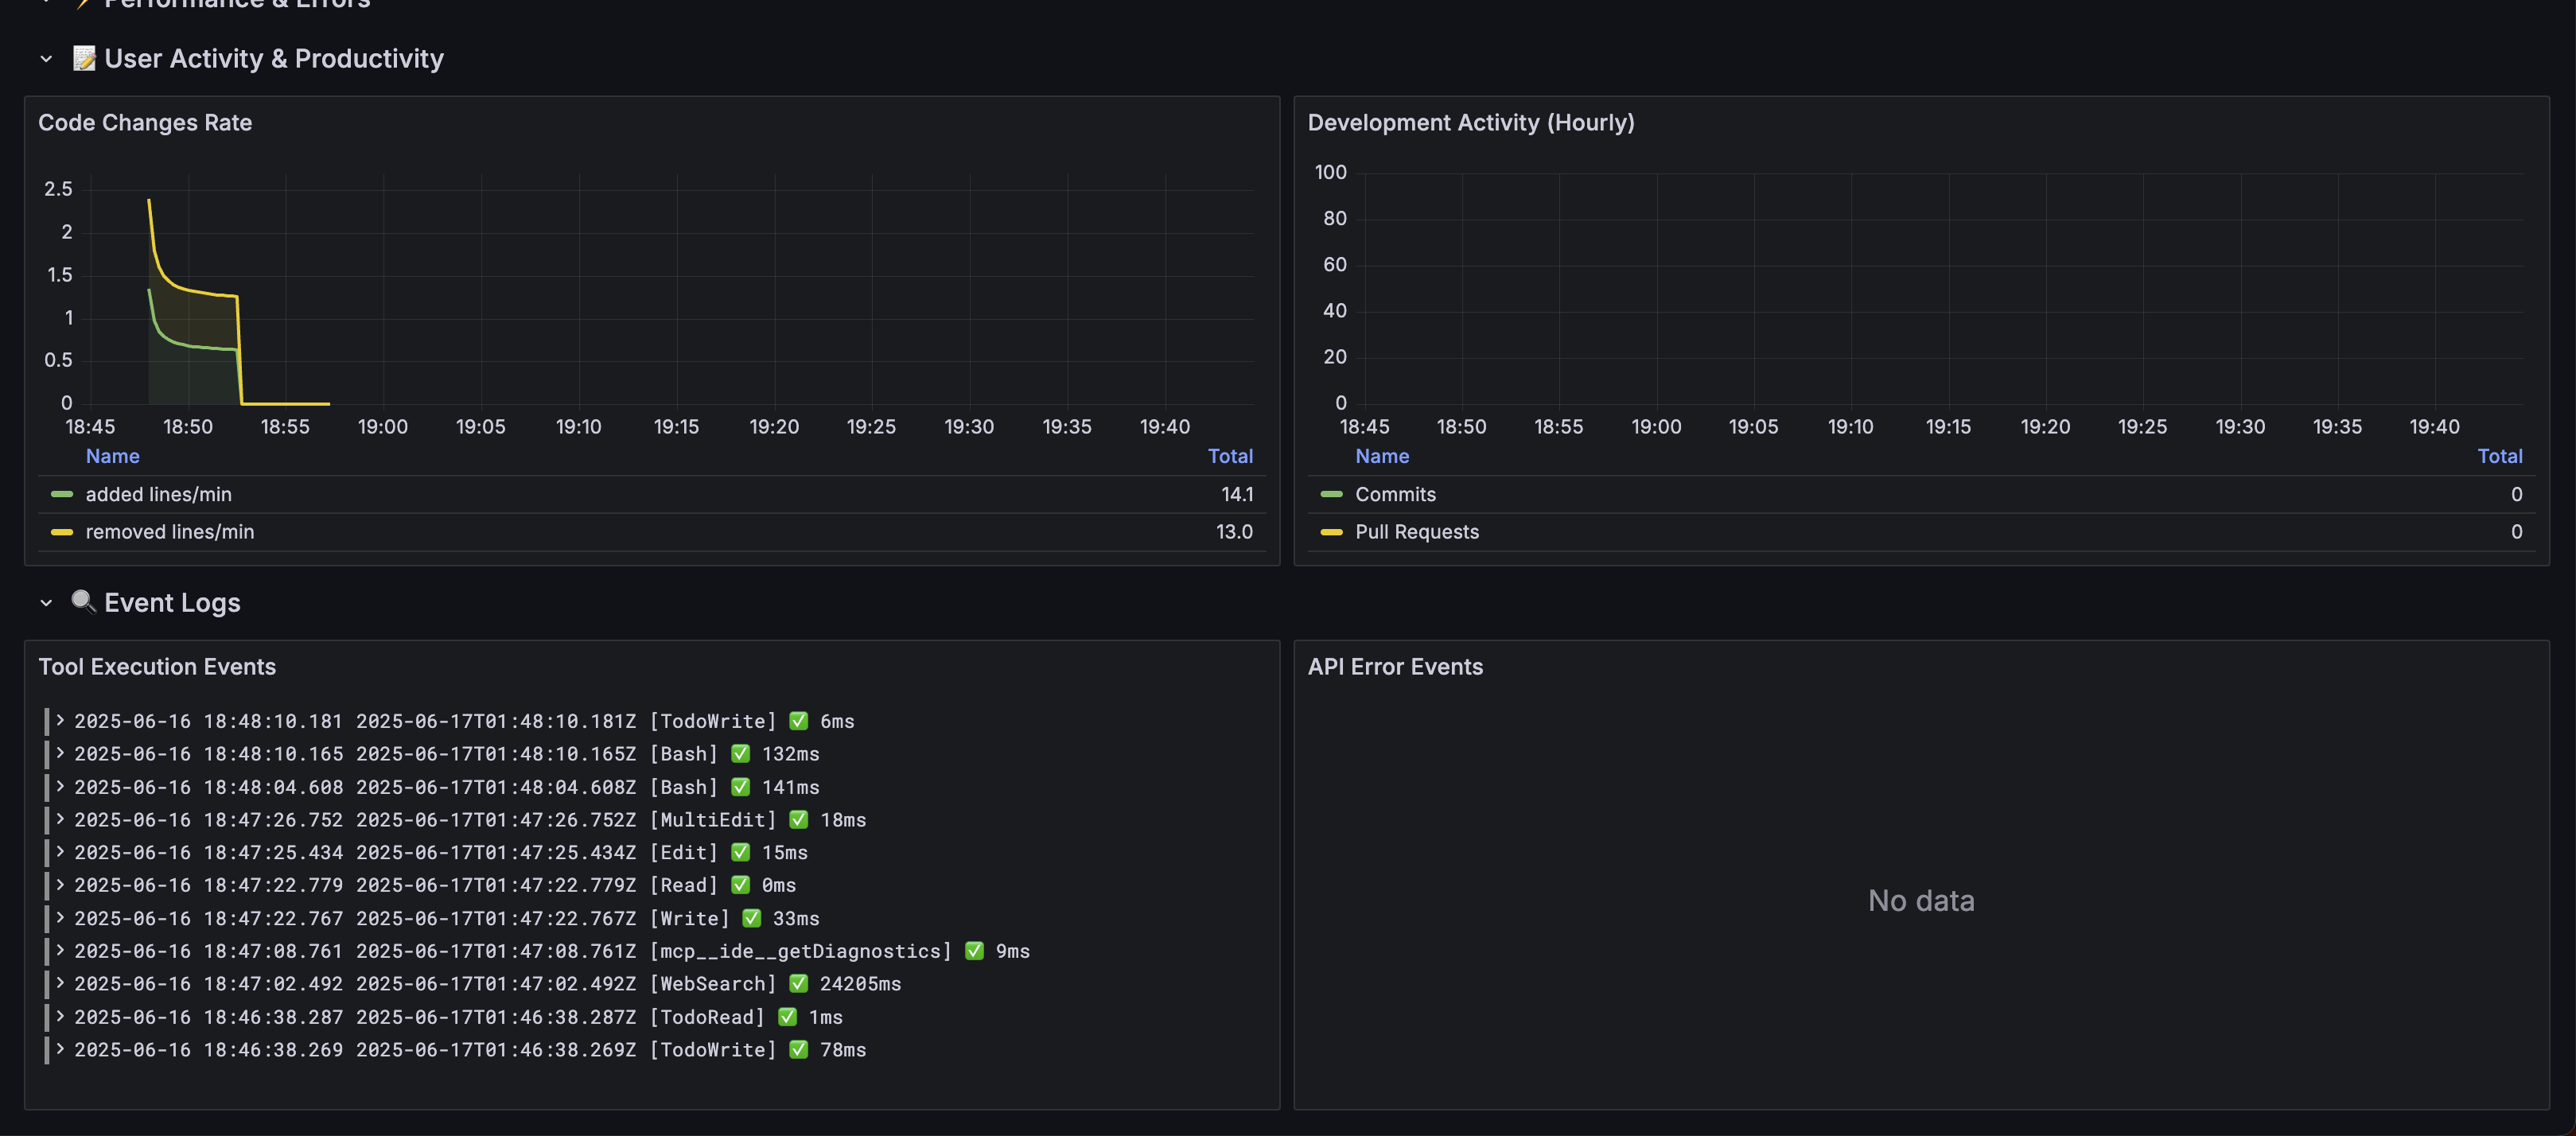
Features: Session tracking, tool performance metrics, code productivity insights
Claude Code → OpenTelemetry Collector → Prometheus (metrics) + Loki (events/logs)
                                     ↓
                              Grafana (visualization & analysis)
| Service | Purpose | Port | UI |
|---|---|---|---|
| OpenTelemetry Collector | Metrics/logs ingestion | 4317 (gRPC), 4318 (HTTP) | - |
| Prometheus | Metrics storage & querying | 9090 | http://localhost:9090 |
| Loki | Log aggregation & storage | 3100 | - |
| Grafana | Dashboards & visualization | 3000 | http://localhost:3000 |
# Start all services
make up

# Check status
make status
# Enable telemetry
export CLAUDE_CODE_ENABLE_TELEMETRY=1

# Configure exporters
export OTEL_METRICS_EXPORTER=otlp
export OTEL_LOGS_EXPORTER=otlp
export OTEL_EXPORTER_OTLP_PROTOCOL=grpc
export OTEL_EXPORTER_OTLP_ENDPOINT=http://localhost:4317

# For debugging (faster export intervals)
export OTEL_METRIC_EXPORT_INTERVAL=10000
export OTEL_LOGS_EXPORT_INTERVAL=5000

# Run Claude Code
claude
🖼️ Visual Guide: Check out the Dashboard Screenshots to see what your dashboards will look like!
Based on the Claude Code Observability Documentation, this stack monitors:
claude_code.session.count - CLI sessions startedclaude_code.lines_of_code.count - Lines of code modified (added/removed)claude_code.pull_request.count - Pull requests createdclaude_code.commit.count - Git commits createdclaude_code.cost.usage - Cost of sessions by modelclaude_code.token.usage - Token usage (input/output/cache/creation)claude_code.code_edit_tool.decision - Tool permission decisionsclaude_code.user_prompt - User prompt submissionsclaude_code.tool_result - Tool execution results and timingsclaude_code.api_request - API requests with duration and tokensclaude_code.api_error - API errors with status codesclaude_code.tool_decision - Tool permission decisionsAccess comprehensive analytics through the Grafana dashboard at http://localhost:3000:
💡 See Dashboard Screenshots above for visual examples
The Grafana dashboard is organized into sections reflecting the observability documentation recommendations:
Key configuration options (see CLAUDE_OBSERVABILITY.md for complete reference):
# Core telemetry
CLAUDE_CODE_ENABLE_TELEMETRY=1

# Exporter configuration
OTEL_METRICS_EXPORTER=otlp,prometheus    # Multiple exporters
OTEL_LOGS_EXPORTER=otlp

# Protocol and endpoints
OTEL_EXPORTER_OTLP_PROTOCOL=grpc
OTEL_EXPORTER_OTLP_ENDPOINT=http://localhost:4317
OTEL_EXPORTER_OTLP_HEADERS="Authorization=Bearer token"

# Export intervals
OTEL_METRIC_EXPORT_INTERVAL=60000        # 1 minute (production)
OTEL_LOGS_EXPORT_INTERVAL=5000           # 5 seconds

# Privacy controls
OTEL_LOG_USER_PROMPTS=1                   # Enable prompt content logging

# Cardinality control
OTEL_METRICS_INCLUDE_SESSION_ID=true
OTEL_METRICS_INCLUDE_VERSION=false
OTEL_METRICS_INCLUDE_ACCOUNT_UUID=true
The OpenTelemetry collector is configured with:
Following the documentation recommendations:
# Stack management
make up                    # Start all services
make down                  # Stop all services
make restart              # Restart services
make clean                # Clean up containers and volumes

# Monitoring
make logs                 # View all logs
make logs-collector       # View collector logs only
make status              # Show service status

# Validation
make validate-config     # Validate all configs
make setup-claude       # Show Claude Code setup instructions
This observability stack implements the patterns and recommendations from the official Claude Code documentation. To contribute:
This project is licensed under the MIT License - see the LICENSE file for details.
1000+ skills curated from Anthropic, Vercel, Stripe, and other engineering teams
Agent harness performance optimization with skills, instincts, memory, and security
Design enforcement with memory — keeps your UI consistent across a project
Detects 37 AI writing patterns and rewrites text with human rhythm across 5 voice profiles
