

Are you the author? Sign in to claim
Gift your VS Code agent a real debugger: breakpoints, stepping, inspection.
Let AI agents debug your code inside VS Code - set breakpoints, step through execution, inspect variables, and evaluate expressions. Works with Codex, GitHub Copilot, GitHub Copilot CLI, Cline, Cursor, Windsurf, Roo Code, and any MCP-compatible assistant. Compatible with any VS Code supported coding language.
![]()
![]()
![]()
![]()
⭐ If you find DebugMCP useful, please star the repo on GitHub! It helps others discover the project and motivates continued development.
📢 Developers Notice: This extension is maintained by ozzafar@microsoft.com and orbarila@microsoft.com. We welcome feedback and contributions to help improve this extension.
🎬 Watch DebugMCP in action — your AI assistant autonomously sets breakpoints, steps through code, and inspects variables directly in VS Code.
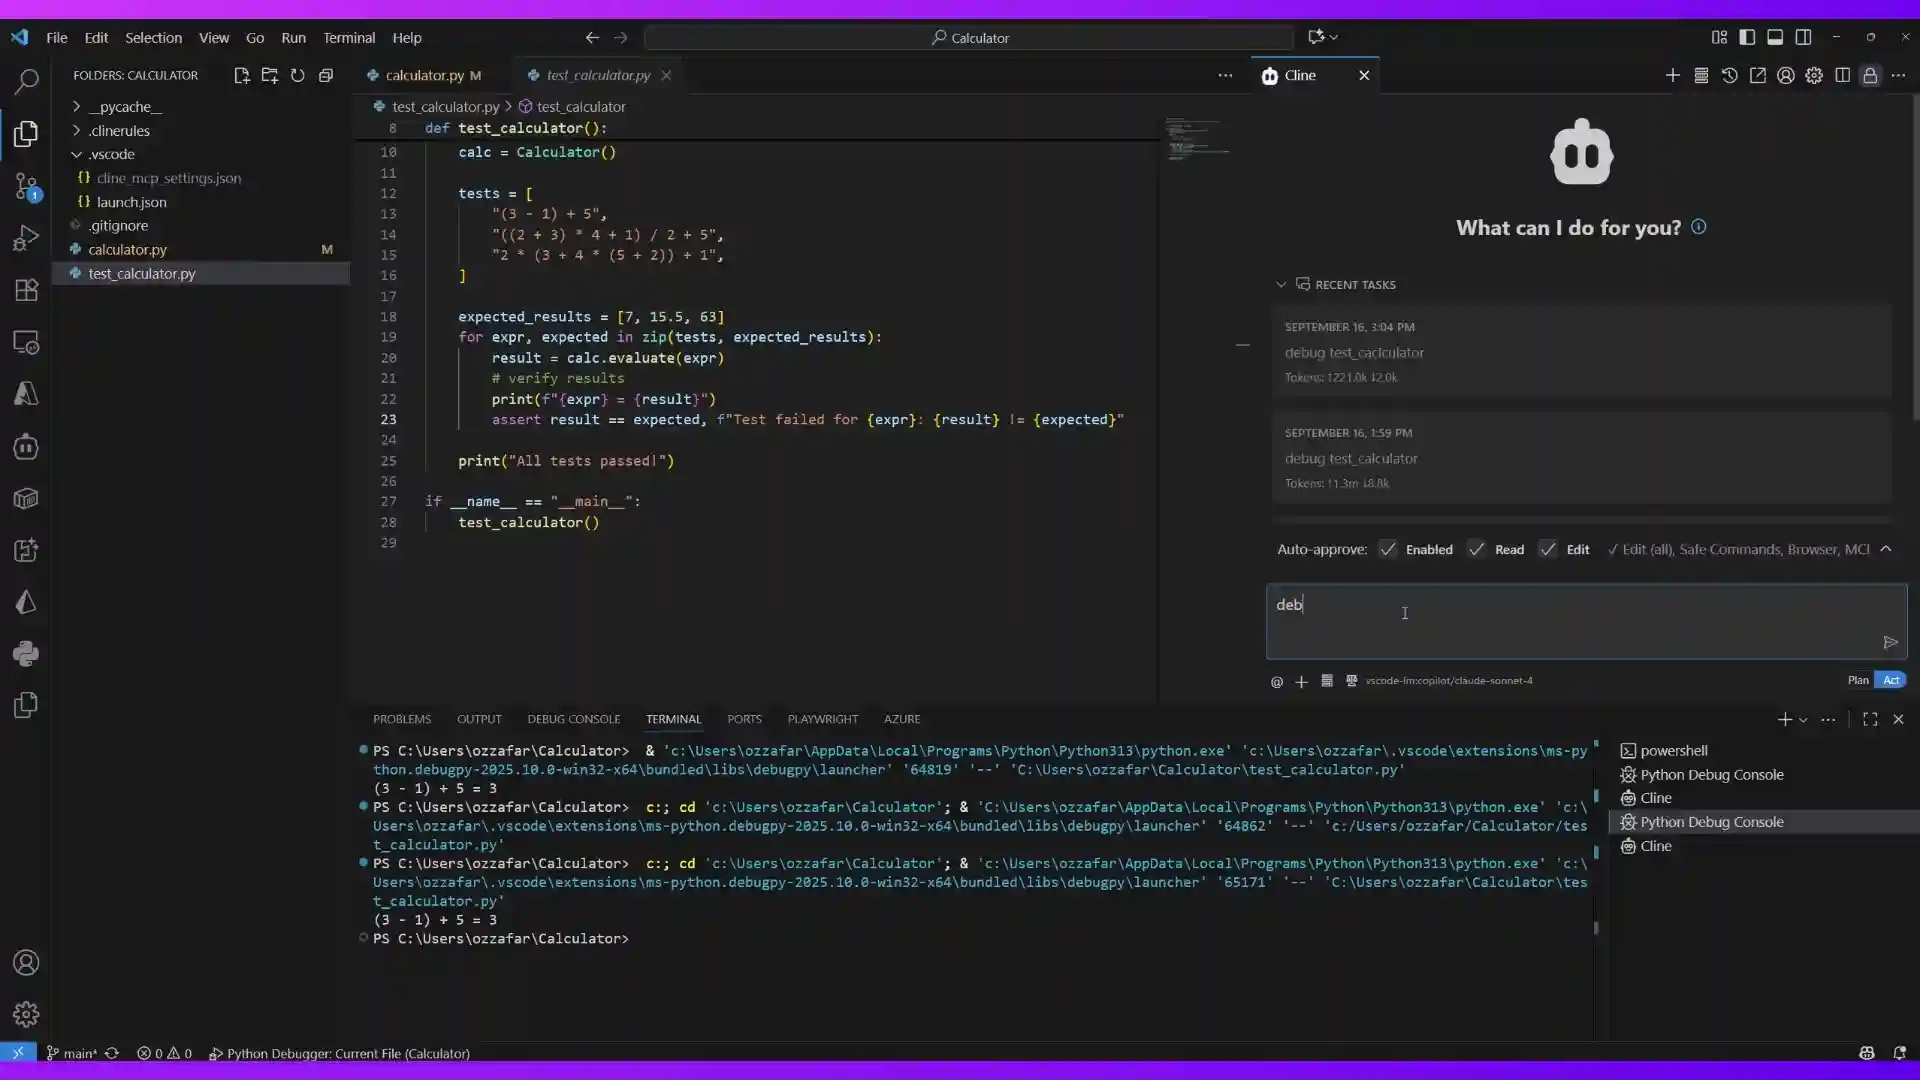
/debug Agent Skill — DebugMCP now ships a companion Agent Skill that is auto-installed into each configured harness's personal skills directory (e.g. ~/.copilot/skills/debug/). Invoke it with /debug in supporting agents to load the systematic debugging workflow and trigger DebugMCP tools with the right context.start_debugging with a testName now uses the VS Code Testing API to discover and launch the test, replacing the previous best-effort path. This works reliably across language test runners that integrate with the Testing API (pytest, Jest/Vitest, Java, .NET, Go, etc.) and produces consistent breakpoint hits inside individual test cases.Install from VS Code Marketplace or use the direct link: vscode:extension/ozzafar.debugmcpextension
DebugMCP is an MCP server that gives AI coding agents full control over the VS Code debugger. Instead of reading logs or guessing, your AI assistant can autonomously set breakpoints, launch debug sessions, step through code line by line, inspect variable values, and evaluate expressions — just like a human developer would. It runs 100% locally, requires zero configuration, and works out of the box with any MCP-compatible AI assistant.
| Tool | Description | Parameters |
|---|---|---|
| start_debugging | Start a debug session for a source code file | fileFullPath (required)workingDirectory (required)testName (optional)configurationName (optional) |
| stop_debugging | Stop the current debug session | None |
| step_over | Execute the next line (step over function calls) | None |
| step_into | Step into function calls | None |
| step_out | Step out of the current function | None |
| continue_execution | Continue until next breakpoint | None |
| restart_debugging | Restart the current debug session | None |
| add_breakpoint | Add a breakpoint at a specific line | fileFullPath (required)lineContent (required) |
| remove_breakpoint | Remove a breakpoint from a specific line | fileFullPath (required)line (required) |
| clear_all_breakpoints | Remove all breakpoints at once | None |
| list_breakpoints | List all active breakpoints | None |
| get_variables_values | Get variables and their values at current execution point | scope (optional: 'local', 'global', 'all') |
| evaluate_expression | Evaluate an expression in debug context | expression (required) |
Note: The MCP server intentionally exposes tools only — no procedural instructions, no documentation resources. Workflow guidance (when to debug, how to structure a root-cause investigation, language-specific quirks) lives in the companion DebugMCP Agent Skill so it can be loaded into an agent's prompt context independently of the MCP capability surface.
DebugMCP follows systematic debugging practices for effective issue resolution:
Option 1: Direct Link (Fastest)
vscode:extension/ozzafar.debugmcpextensionOption 2: VS Code Marketplace
Option 3: Within VS Code
After installation, you should see:
📝 Note: No additional debugging rule instructions are needed - the extension works out of the box.
💡 Tip: Enable auto-approval for all debugmcp tools in your AI assistant to create seamless debugging workflows without constant approval interruptions.
DebugMCP works with any MCP-compatible AI assistant. It auto-detects and offers to register itself with:
| Assistant | Auto-Registration | Manual Config |
|---|---|---|
| GitHub Copilot | ✅ | See config |
| GitHub Copilot CLI | ✅ | See config |
| Cline | ✅ | See config |
| Cursor | ✅ | See config |
| Codex | ✅ | See config |
| Windsurf | ✅ | See config |
| Roo Code | ✅ | See config |
| Antigravity | ✅ | See config |
| Any MCP-compatible assistant | — | See manual setup |
DebugMCP supports debugging for the following languages with their respective VSCode extensions:
| Language | Extension Required | File Extensions | Status |
|---|---|---|---|
| Python | Python | .py | ✅ Fully Supported |
| JavaScript/TypeScript | Built-in / JS Debugger | .js, .ts, .jsx, .tsx | ✅ Fully Supported |
| Java | Extension Pack for Java | .java | ✅ Fully Supported |
| C/C++ | C/C++ | .c, .cpp, .cc | ✅ Fully Supported |
| Go | Go | .go | ✅ Fully Supported |
| Rust | rust-analyzer | .rs | ✅ Fully Supported |
| PHP | PHP Debug | .php | ✅ Fully Supported |
| Ruby | Ruby | .rb | ✅ Fully Supported |
| C#/.NET | C# | .cs, .csproj | ✅ Fully Supported |
The extension runs an MCP server automatically. It will pop up a message to auto-register the MCP server in your AI assistant.
You can also trigger the registration manually via the Command Palette:
DebugMCP: Show Agent Selection Popup🔄 Auto-Migration: If you previously configured DebugMCP with SSE transport, the extension will automatically migrate your configuration to the new Streamable HTTP transport on activation.
Add to your Cline settings or cline_mcp_settings.json:
{
  "mcpServers": {
    "debugmcp": {
      "type": "streamableHttp",
      "url": "http://localhost:3001/mcp",
      "description": "DebugMCP - AI-powered debugging assistant"
    }
  }
}
Add to your VS Code settings (settings.json):
{
  "mcp": {
    "servers": {
      "debugmcp": {
        "type": "http",
        "url": "http://localhost:3001/mcp",
        "description": "DebugMCP - Multi-language debugging support"
      }
    }
  }
}
Add to ~/.copilot/mcp-config.json (${COPILOT_HOME}/mcp-config.json if COPILOT_HOME is set):
{
  "mcpServers": {
    "debugmcp": {
      "type": "http",
      "url": "http://localhost:3001/mcp",
      "tools": ["*"]
    }
  }
}
Add to Cursor's MCP settings:
{
  "mcpServers": {
    "debugmcp": {
      "type": "streamableHttp",
      "url": "http://localhost:3001/mcp",
      "description": "DebugMCP - Debugging tools for AI assistants"
    }
  }
}
Register DebugMCP with Codex:
codex mcp add debugmcp --url http://localhost:3001/mcp
Or add the equivalent configuration to ~/.codex/config.toml (${CODEX_HOME}/config.toml if CODEX_HOME is set):
[mcp_servers.debugmcp]
url = "http://localhost:3001/mcp"
Add to Windsurf's MCP settings (~/.windsurf/mcp_settings.json or workspace .windsurf/mcp_settings.json):
{
  "mcpServers": {
    "debugmcp": {
      "type": "streamableHttp",
      "url": "http://localhost:3001/mcp",
      "description": "DebugMCP - Debugging tools for AI assistants"
    }
  }
}
Add to Roo Code's MCP settings:
{
  "mcpServers": {
    "debugmcp": {
      "type": "streamableHttp",
      "url": "http://localhost:3001/mcp",
      "description": "DebugMCP - Debugging tools for AI assistants"
    }
  }
}
Add to Antigravity's MCP settings:
{
  "mcpServers": {
    "debugmcp": {
      "type": "streamableHttp",
      "url": "http://localhost:3001/mcp",
      "description": "DebugMCP - Debugging tools for AI assistants"
    }
  }
}
Configure DebugMCP behavior in VSCode settings:
{
  "debugmcp.serverPort": 3001,
  "debugmcp.timeoutInSeconds": 180,
  "debugmcp.bindHost": ["127.0.0.1", "::1"]
}
| Setting | Default | Description |
|---|---|---|
debugmcp.serverPort | 3001 | Port number for the MCP server |
debugmcp.timeoutInSeconds | 180 | Timeout for debugging operations |
debugmcp.bindHost | ["127.0.0.1", "::1"] | Network interface(s) the HTTP server binds to. Accepts a string or array of strings. See Security model before changing. |
DebugMCP exposes powerful debugger primitives (evaluate_expression, start_debugging, …) over an unauthenticated local HTTP endpoint. To keep that surface safe, the server enforces two controls:
127.0.0.1 and ::1) by default, so other hosts on your network cannot reach http://<your-ip>:3001/mcp. Binding both families ensures clients that resolve localhost to either family connect successfully. The debugmcp.bindHost setting (string or array of strings) lets you opt into a different interface (for example, when forwarding the port into a remote container), but doing so exposes the unauthenticated debugger to anything that can route to that address — do not point it at 0.0.0.0 or a LAN address on an untrusted network.Host header naming a loopback address (localhost, 127.0.0.1, or [::1]); any port suffix in the Host must also match the server's listening port. Requests with any other Host — including those that arrive via DNS rebinding from a malicious webpage — are rejected with HTTP 403. The same loopback check is applied to the Origin header when present.DebugMCP works with any MCP-compatible AI assistant, including GitHub Copilot, GitHub Copilot CLI, Cline, Cursor, Codex, Windsurf, Roo Code, Antigravity, and others. If your assistant supports the Model Context Protocol, it can use DebugMCP.
Yes. DebugMCP runs as a VS Code extension with extensionKind: workspace, so it activates in the remote environment where your code lives. The MCP server runs on localhost within that remote context.
No. DebugMCP automatically generates appropriate debug configurations based on the file's language/extension. If you have a launch.json, it will automatically pick the most relevant configuration.
No. DebugMCP runs 100% locally. The MCP server runs on localhost, and no code, variables, or debug data is sent to any external service. The AI assistant communicates with the MCP server entirely within your local machine.
Change the port in VS Code settings: "debugmcp.serverPort": 3002 (or any available port). Then update your AI assistant's MCP configuration to use the new port.
Yes. Pass the testName parameter to start_debugging to debug a specific test method. DebugMCP will configure the debug session to run and pause at breakpoints within that test.
Make sure DebugMCP is registered in your AI assistant's MCP settings. The extension should auto-detect and offer to register itself. If not, see the Manual MCP Server Registration section. Also enable auto-approval for DebugMCP tools for a smoother workflow.
Yes. DebugMCP supports .cs files and .csproj project files for C#/.NET debugging, including ASP.NET applications.
DebugMCP: Show Agent Selection Popup from the Command Palette (Ctrl+Shift+P / Cmd+Shift+P)
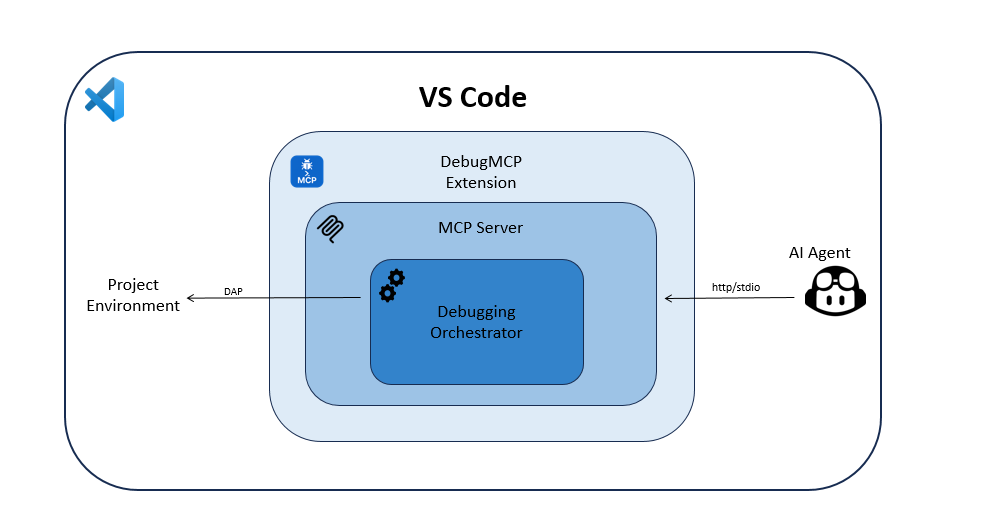
AI Agent (Copilot/Cline/Cursor/Codex) → MCP/Streamable HTTP → DebugMCPServer → DebuggingHandler → VS Code Debug API
The extension handles debug configurations intelligently:
Existing launch.json: If a .vscode/launch.json file exists, it will:
configurationName when explicitly provided by the agentDefault Configuration: If configurationName is omitted, or if no matching named configuration is found, it creates an appropriate default configuration for each language based on file extension detection
.py filesTo build the extension:
npm install
npm run compile
To run linting:
npm run lint
To run tests:
npm test
This project welcomes contributions and suggestions. Most contributions require you to agree to a Contributor License Agreement (CLA) declaring that you have the right to, and actually do, grant us the rights to use your contribution. For details, visit https://cla.opensource.microsoft.com.
When you submit a pull request, a CLA bot will automatically determine whether you need to provide a CLA and decorate the PR appropriately (e.g., status check, comment). Simply follow the instructions provided by the bot. You will only need to do this once across all repos using our CLA.
This project has adopted the Microsoft Open Source Code of Conduct. For more information see the Code of Conduct FAQ or contact opencode@microsoft.com with any additional questions or comments.
Security vulnerabilities should be reported following the guidance at https://aka.ms/SECURITY.md. Please do not report security vulnerabilities through public GitHub issues.
This project may contain trademarks or logos for projects, products, or services. Authorized use of Microsoft trademarks or logos is subject to and must follow Microsoft's Trademark & Brand Guidelines. Use of Microsoft trademarks or logos in modified versions of this project must not cause confusion or imply Microsoft sponsorship. Any use of third-party trademarks or logos are subject to those third-party's policies.
If DebugMCP has helped you debug faster, please consider giving it a star on GitHub! Stars help the project gain visibility and attract contributors.
MIT License - See LICENSE for details
This extension was created by Oz Zafar, Ori Bar-Ilan and Karin Brisker.
Run Claude Code as an MCP server so any agent can delegate coding tasks to it
Browser automation using accessibility snapshots instead of screenshots
Google's universal MCP server supporting PostgreSQL, MySQL, MongoDB, Redis, and 10+ databases
Official GitHub integration for repos, issues, PRs, and CI/CD workflows