

Are you the author? Sign in to claim
Plug-and-play homelab dashboard in one container — GPU, local-AI VRAM, Docker, systemd, host health. Built-in read-only


One page for your whole home lab & AI rig — GPU truth, tokens/sec, power cost, training runs, containers, disks. No agents, no Prometheus/Grafana, no cloud.
Your home lab grew into a couple of machines, a Pi, and a GPU that's mysteriously always busy — and lately it's running models too. HomeLab Monitor gives you one self-hosted page that answers the real questions: what's that GPU actually doing, which model is holding it, what's it costing you to run, which container is eating RAM, what's filling your disks, and is anything down — across every box over SSH: Linux, a Pi, even Windows. Readable from your phone over the VPN.
# Grab the compose file and go. No GPU required — the GPU panels just light up when one's present.
curl -fsSLO https://raw.githubusercontent.com/SikamikanikoBG/homelab-monitor/main/docker-compose.yml
docker compose up -d
Open http://<your-host>:9800 and you're done. Full options (from source, GPU toolkit, Windows/WSL2) → Install docs.
🆕 v0.16 — the AI Lab Cockpit. GPU throttle truth, live tokens/sec, a per-process Costs page, and push your training runs from Jupyter/Colab/MLflow — each one priced with the real GPU energy it burned. Release notes · changelog.
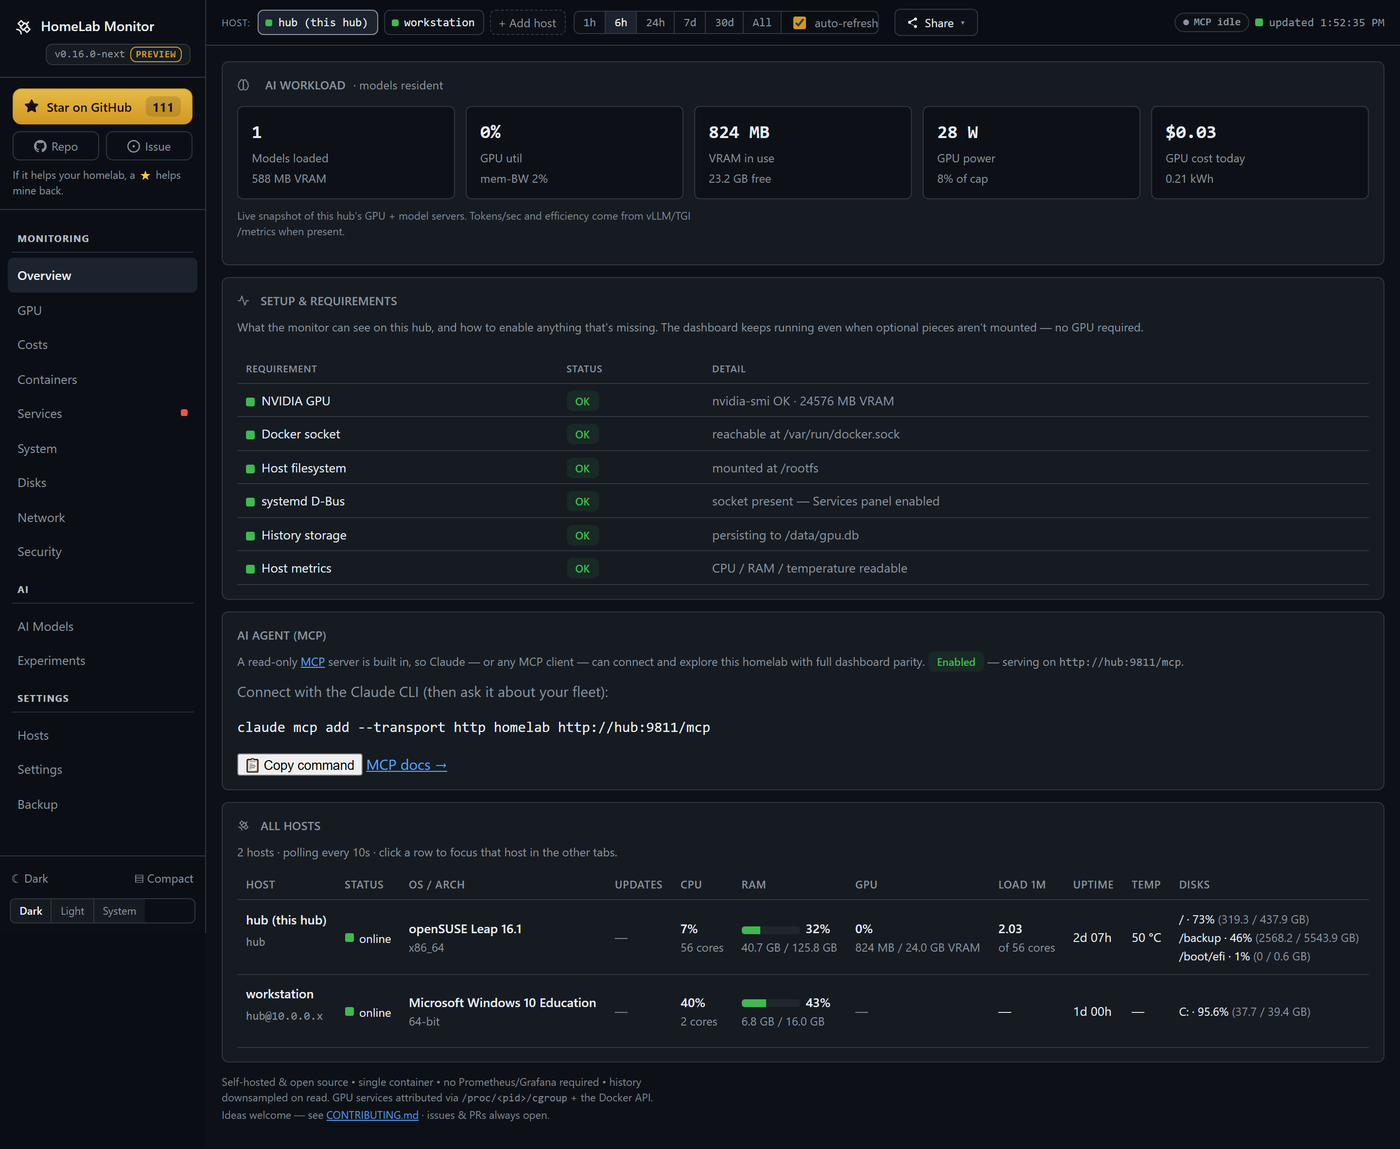
One page, every box, the questions you actually have. The classics are all here — and 0.16 builds a whole AI cockpit on top of them.
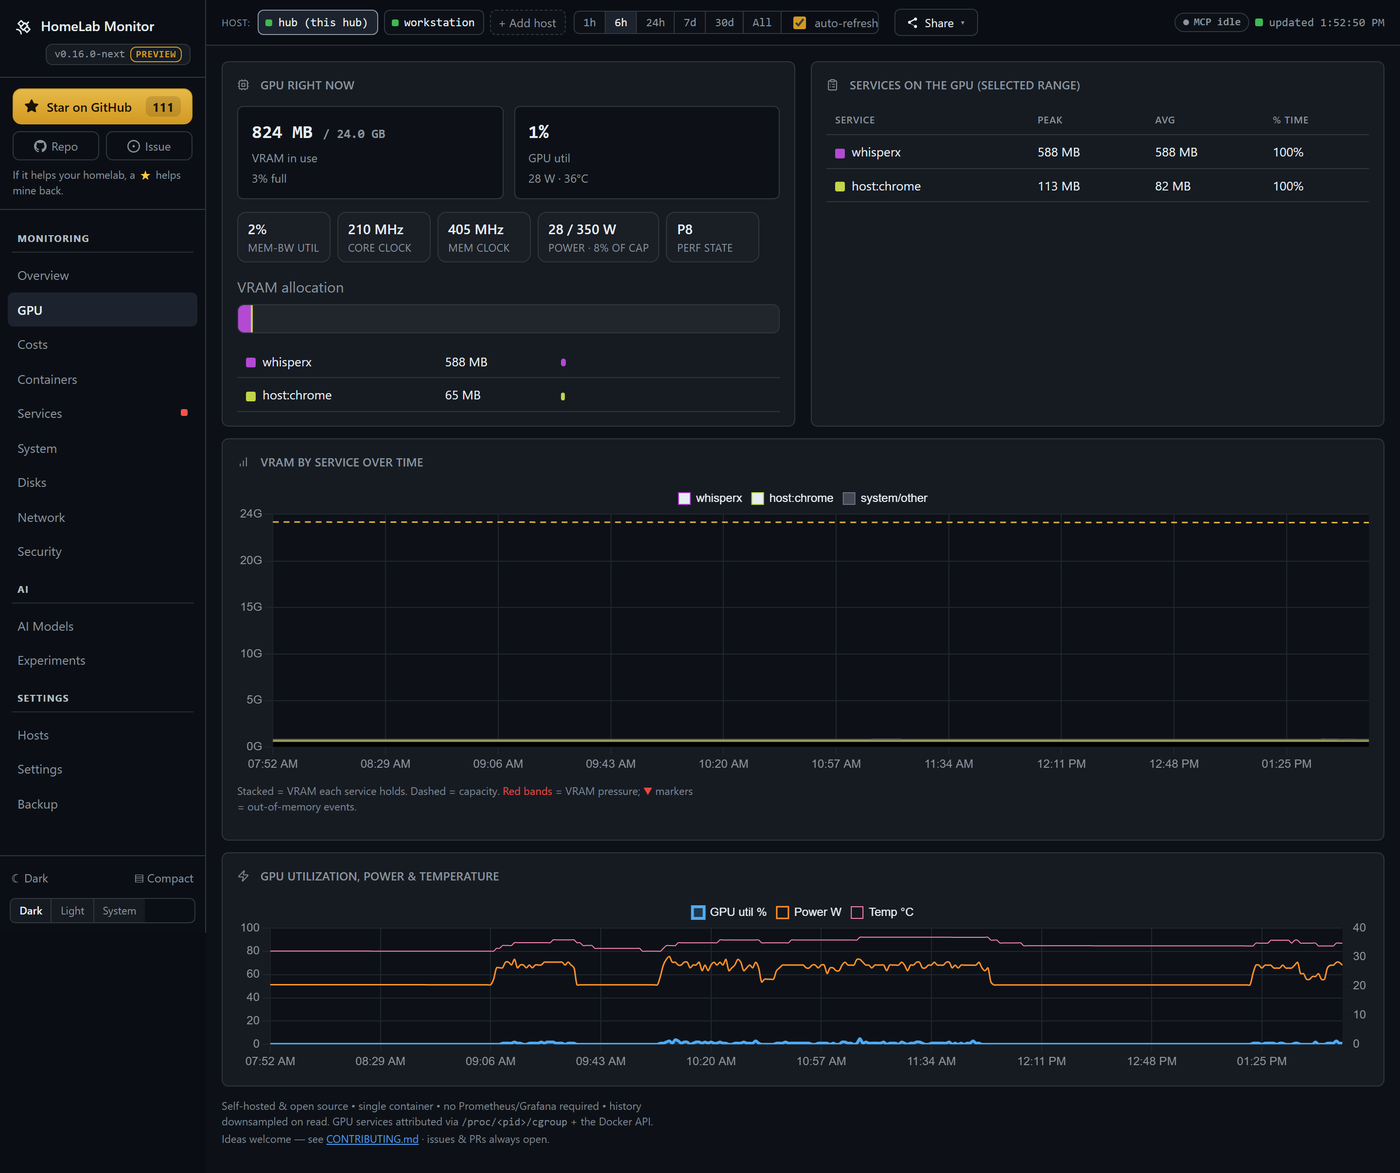
Your GPU, demystified — and honest about it. A card pinned at "100% util" can still be throttling, memory-bandwidth-bound, or quietly drooping its clocks. The GPU tab decodes nvidia-smi's throttle reasons (a red banner the moment it's power-capped or too hot), and shows memory-bandwidth util, core/mem clocks, power-vs-limit and p-state — plus which container is holding the card.
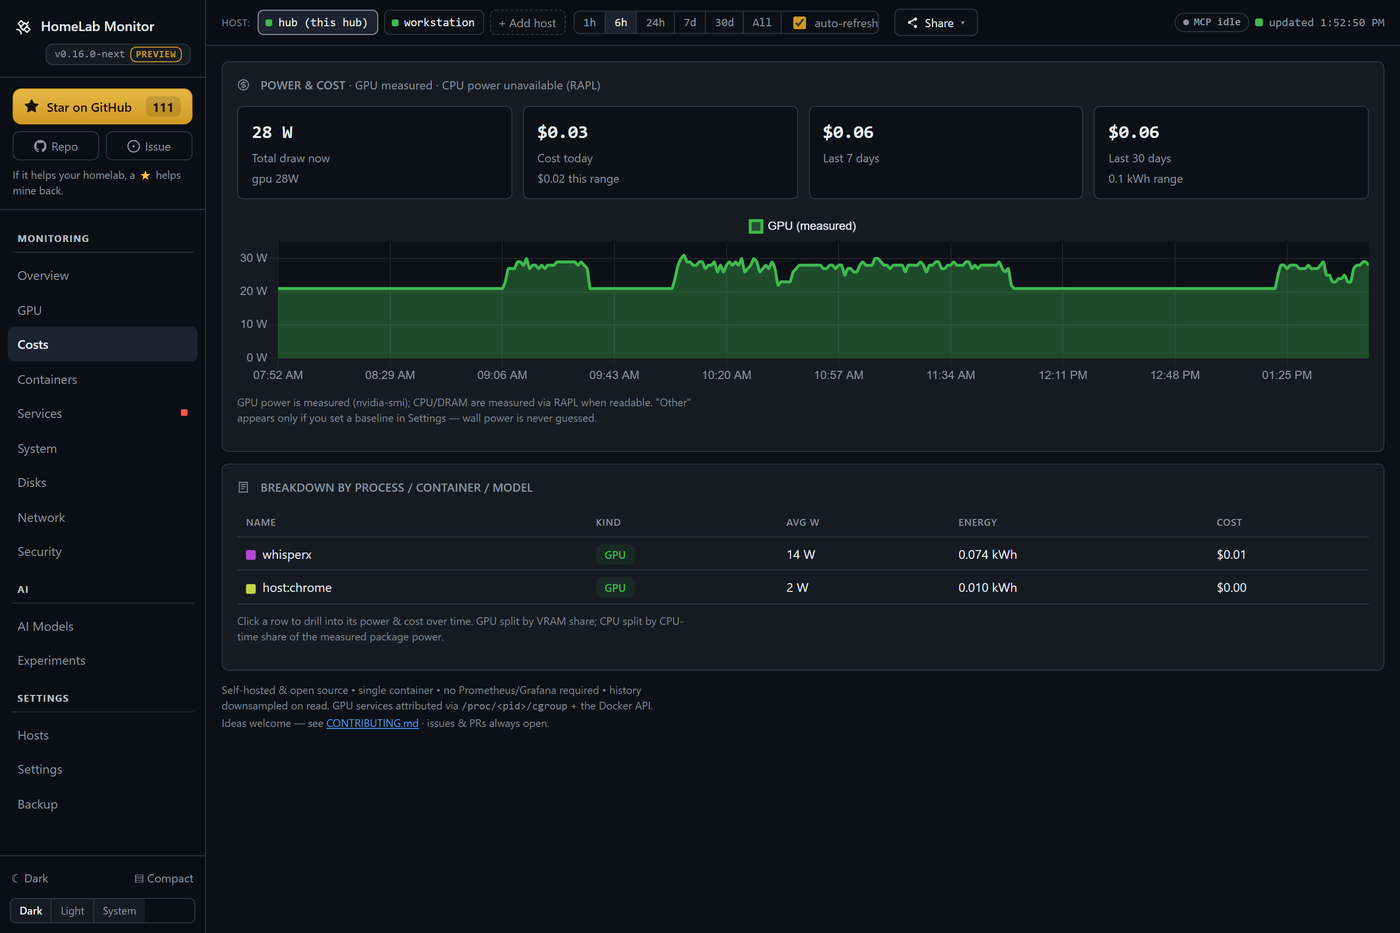
What it costs — down to the process. Power becomes money: per machine, then per component (GPU measured via nvidia-smi, CPU/DRAM via RAPL), then per process, container or model — click any row to see what it drew and what it cost over any window. Day & night tariffs (Economy 7, Heures Creuses, …), or just pick your country for a sensible estimate. Every watt is measured or a baseline you set; wall power is never guessed.
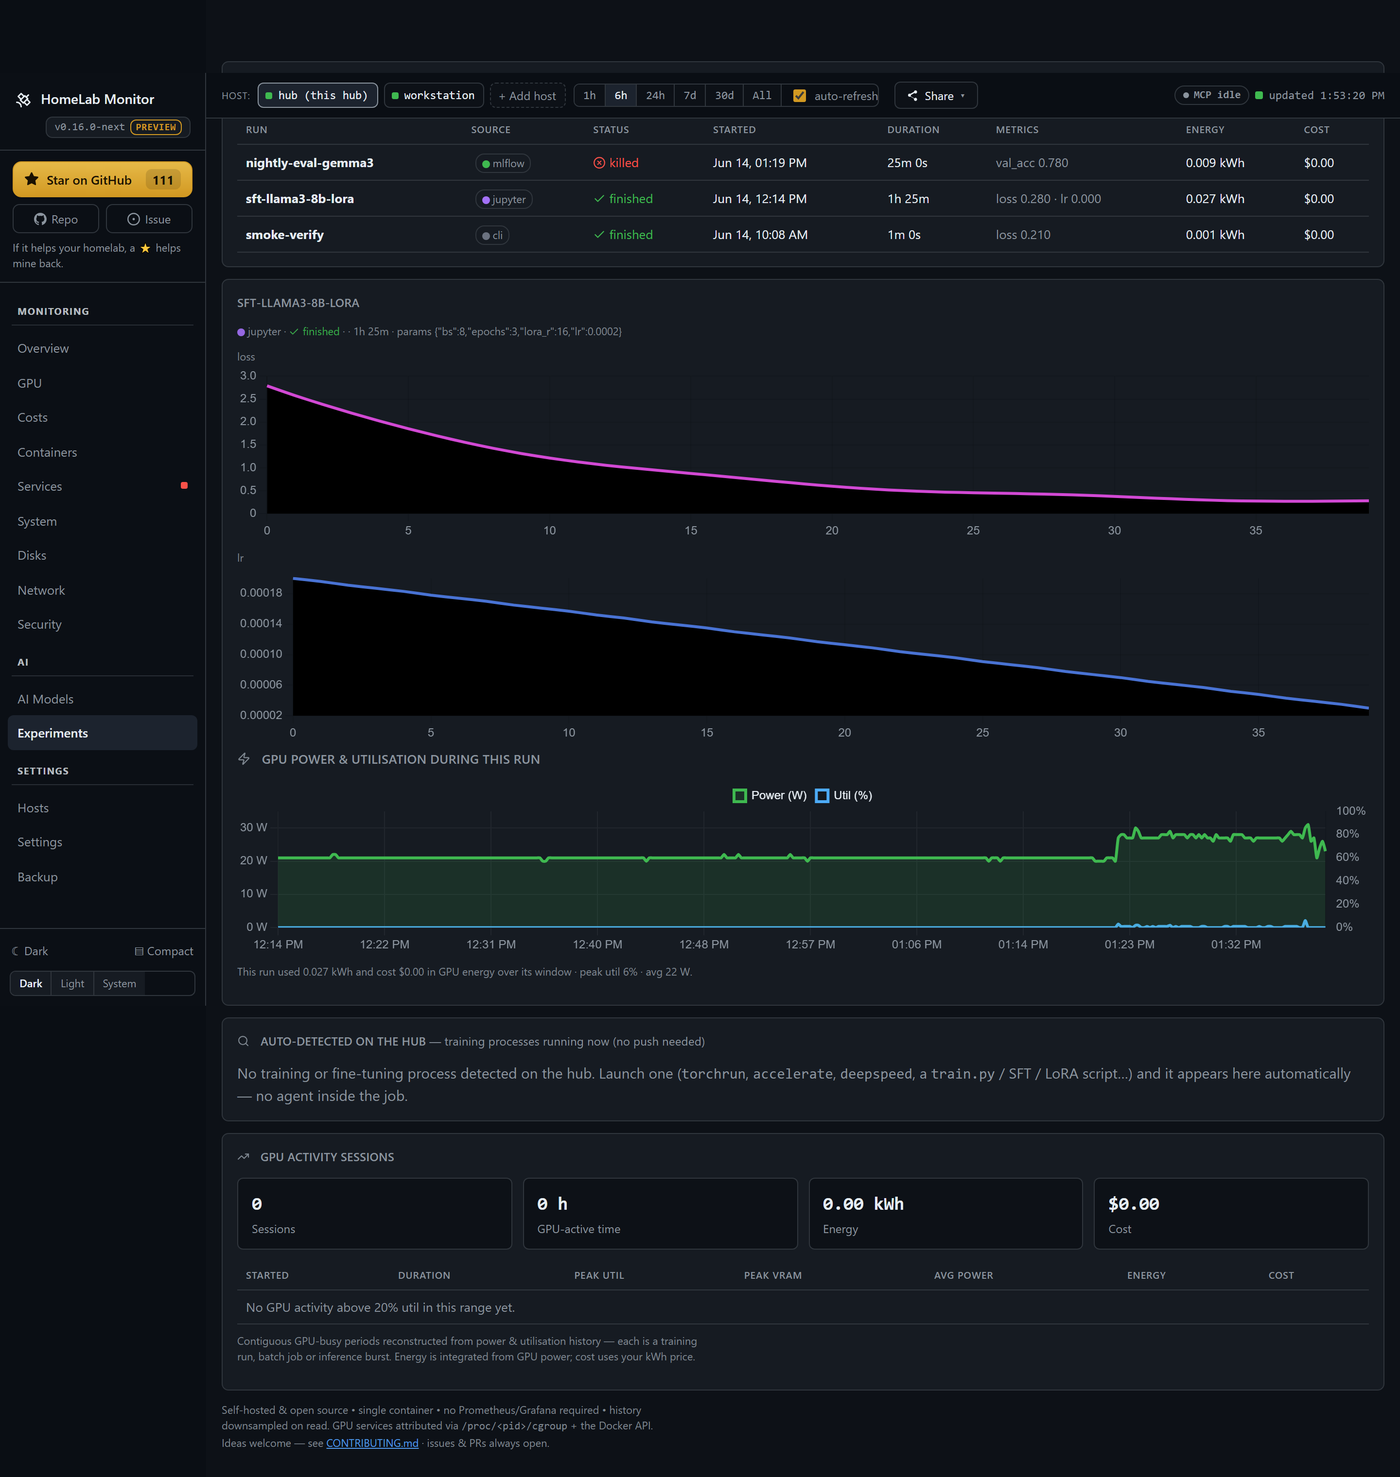
Your training runs, priced. Push a run from Jupyter, Colab or Kaggle with a one-file client (or mirror it from MLflow), and it comes back with the loss curve and the real GPU energy it burned, on the same timeline. Create, name, expire and revoke API keys yourself.
And the rest of the lab, the way it always was:
Full tab-by-tab tour → Features.
Open the Hosts tab, paste the hub's auto-generated SSH key onto each remote, and the hub starts polling it — no agents, just SSH + Python 3 (PowerShell on Windows). The hub pipes a small self-contained probe over SSH; nothing persists on the remote.
Onboarding, Windows setup, and the security model → Multi-machine docs.
Set these under environment: in docker-compose.yml (all optional):
| Variable | Default | Meaning |
|---|---|---|
SAMPLE_INTERVAL | 10 | Seconds between samples |
RETENTION_DAYS | 180 | How long history is kept |
PRESSURE_FREE_MB | 2048 | Free VRAM below this counts as "pressure" |
PORT | 9800 | Dashboard port |
MCP_PORT | 9810 | Port for the built-in read-only MCP server |
ENABLE_MCP | 1 | Set 0 to run the dashboard without the MCP server |
WATCH_CONTAINERS | — | Extra containers to scan for OOM (comma-separated) |
WATCH_SERVICES | — | systemd units to always show, even vendor ones (comma-separated) |
CHECK_UPDATES | true | Set false to disable the daily GitHub-releases check (no outbound calls) |
History lives in ./data/gpu.db (a bind mount), so it survives restarts and upgrades. Alerts, the systemd D-Bus mount, and per-server tuning → Configuration docs.
The hub stitches nvidia-smi, the Docker API, model-server APIs (Ollama, vLLM, llama.cpp, A1111, …), systemd D-Bus, and /proc + /sys into one sampled view, persisted to SQLite and downsampled on read so a six-month range loads as fast as the last hour. Single page, vendored Chart.js, no build step.
/metrics Prometheus endpoint + Grafana dashboard → Prometheus & GrafanaYour homelab is now legible to AI agents — point a client at one URL and it can see every host, container, GPU and disk. Read-only, no extra setup.
HomeLab Monitor isn't just a dashboard for you anymore; it's context for your AI agent too. A read-only MCP server is built into the same container (served on :9810) — so Claude, Claude Code, or any MCP client connects in one line and explores your whole lab through 12 named tools, with the same coverage you see on the dashboard: hosts, containers, systemd services, GPU and who's driving it, per-process RAM, AI model servers, disk treemaps, history and alerts.

Connect any MCP client — Claude, ChatGPT, or an agent on your own local Ollama models — and it reads your homelab's live state. Read-only: both directions are just question and answer.
# the dashboard is on :9800; the MCP server rides along on :9810
claude mcp add --transport http homelab http://YOUR-HUB:9810/mcp
Once connected, skip the tab-hunting and just ask — the agent picks the right tools:
/backup? Give me the biggest folders and flag anything that looks like runaway logs."Read-only by design — there are no write tools, so an agent can look but never touch your fleet. Turn it off anytime with ENABLE_MCP=0. Full tool list & setup → MCP docs.
This is a host monitor: it runs with host access and a read-only Docker socket, root mount, and D-Bus socket — a broad footprint by design. Keep it behind your LAN/VPN/firewall and don't expose it to the public internet. Details → docs.
If HomeLab Monitor saves you a browser tab or two, a ⭐ on GitHub genuinely helps other home-labbers find it. Thank you!
Building this is more fun together. Join the HomeLab Monitor Discord — say hi, show off your rig, swap ideas, ask for help, or just hang out. It's where the roadmap chatter, “should we build X?” questions, and quick help happen — and where new contributors get a warm welcome.
Bring a friend, post an idea, open an issue — let's grow a friendly, healthy homelab community. 💛
Issues and PRs are very welcome — especially new model-server probes, new monitors, and GPU back-ends. This is a hobby tool meant to help fellow home-labbers, so be kind. See CONTRIBUTING.md.
MIT — see LICENSE.
Run Claude Code as an MCP server so any agent can delegate coding tasks to it
Browser automation using accessibility snapshots instead of screenshots
Google's universal MCP server supporting PostgreSQL, MySQL, MongoDB, Redis, and 10+ databases
Official GitHub integration for repos, issues, PRs, and CI/CD workflows