

Are you the author? Sign in to claim
A system monitoring tool that exposes system metrics via the Model Context Protocol (MCP). This tool allows LLMs to retr


A system monitoring tool that exposes system metrics via the Model Context Protocol (MCP). This tool allows LLMs to retrieve real-time system information through an MCP-compatible interface.
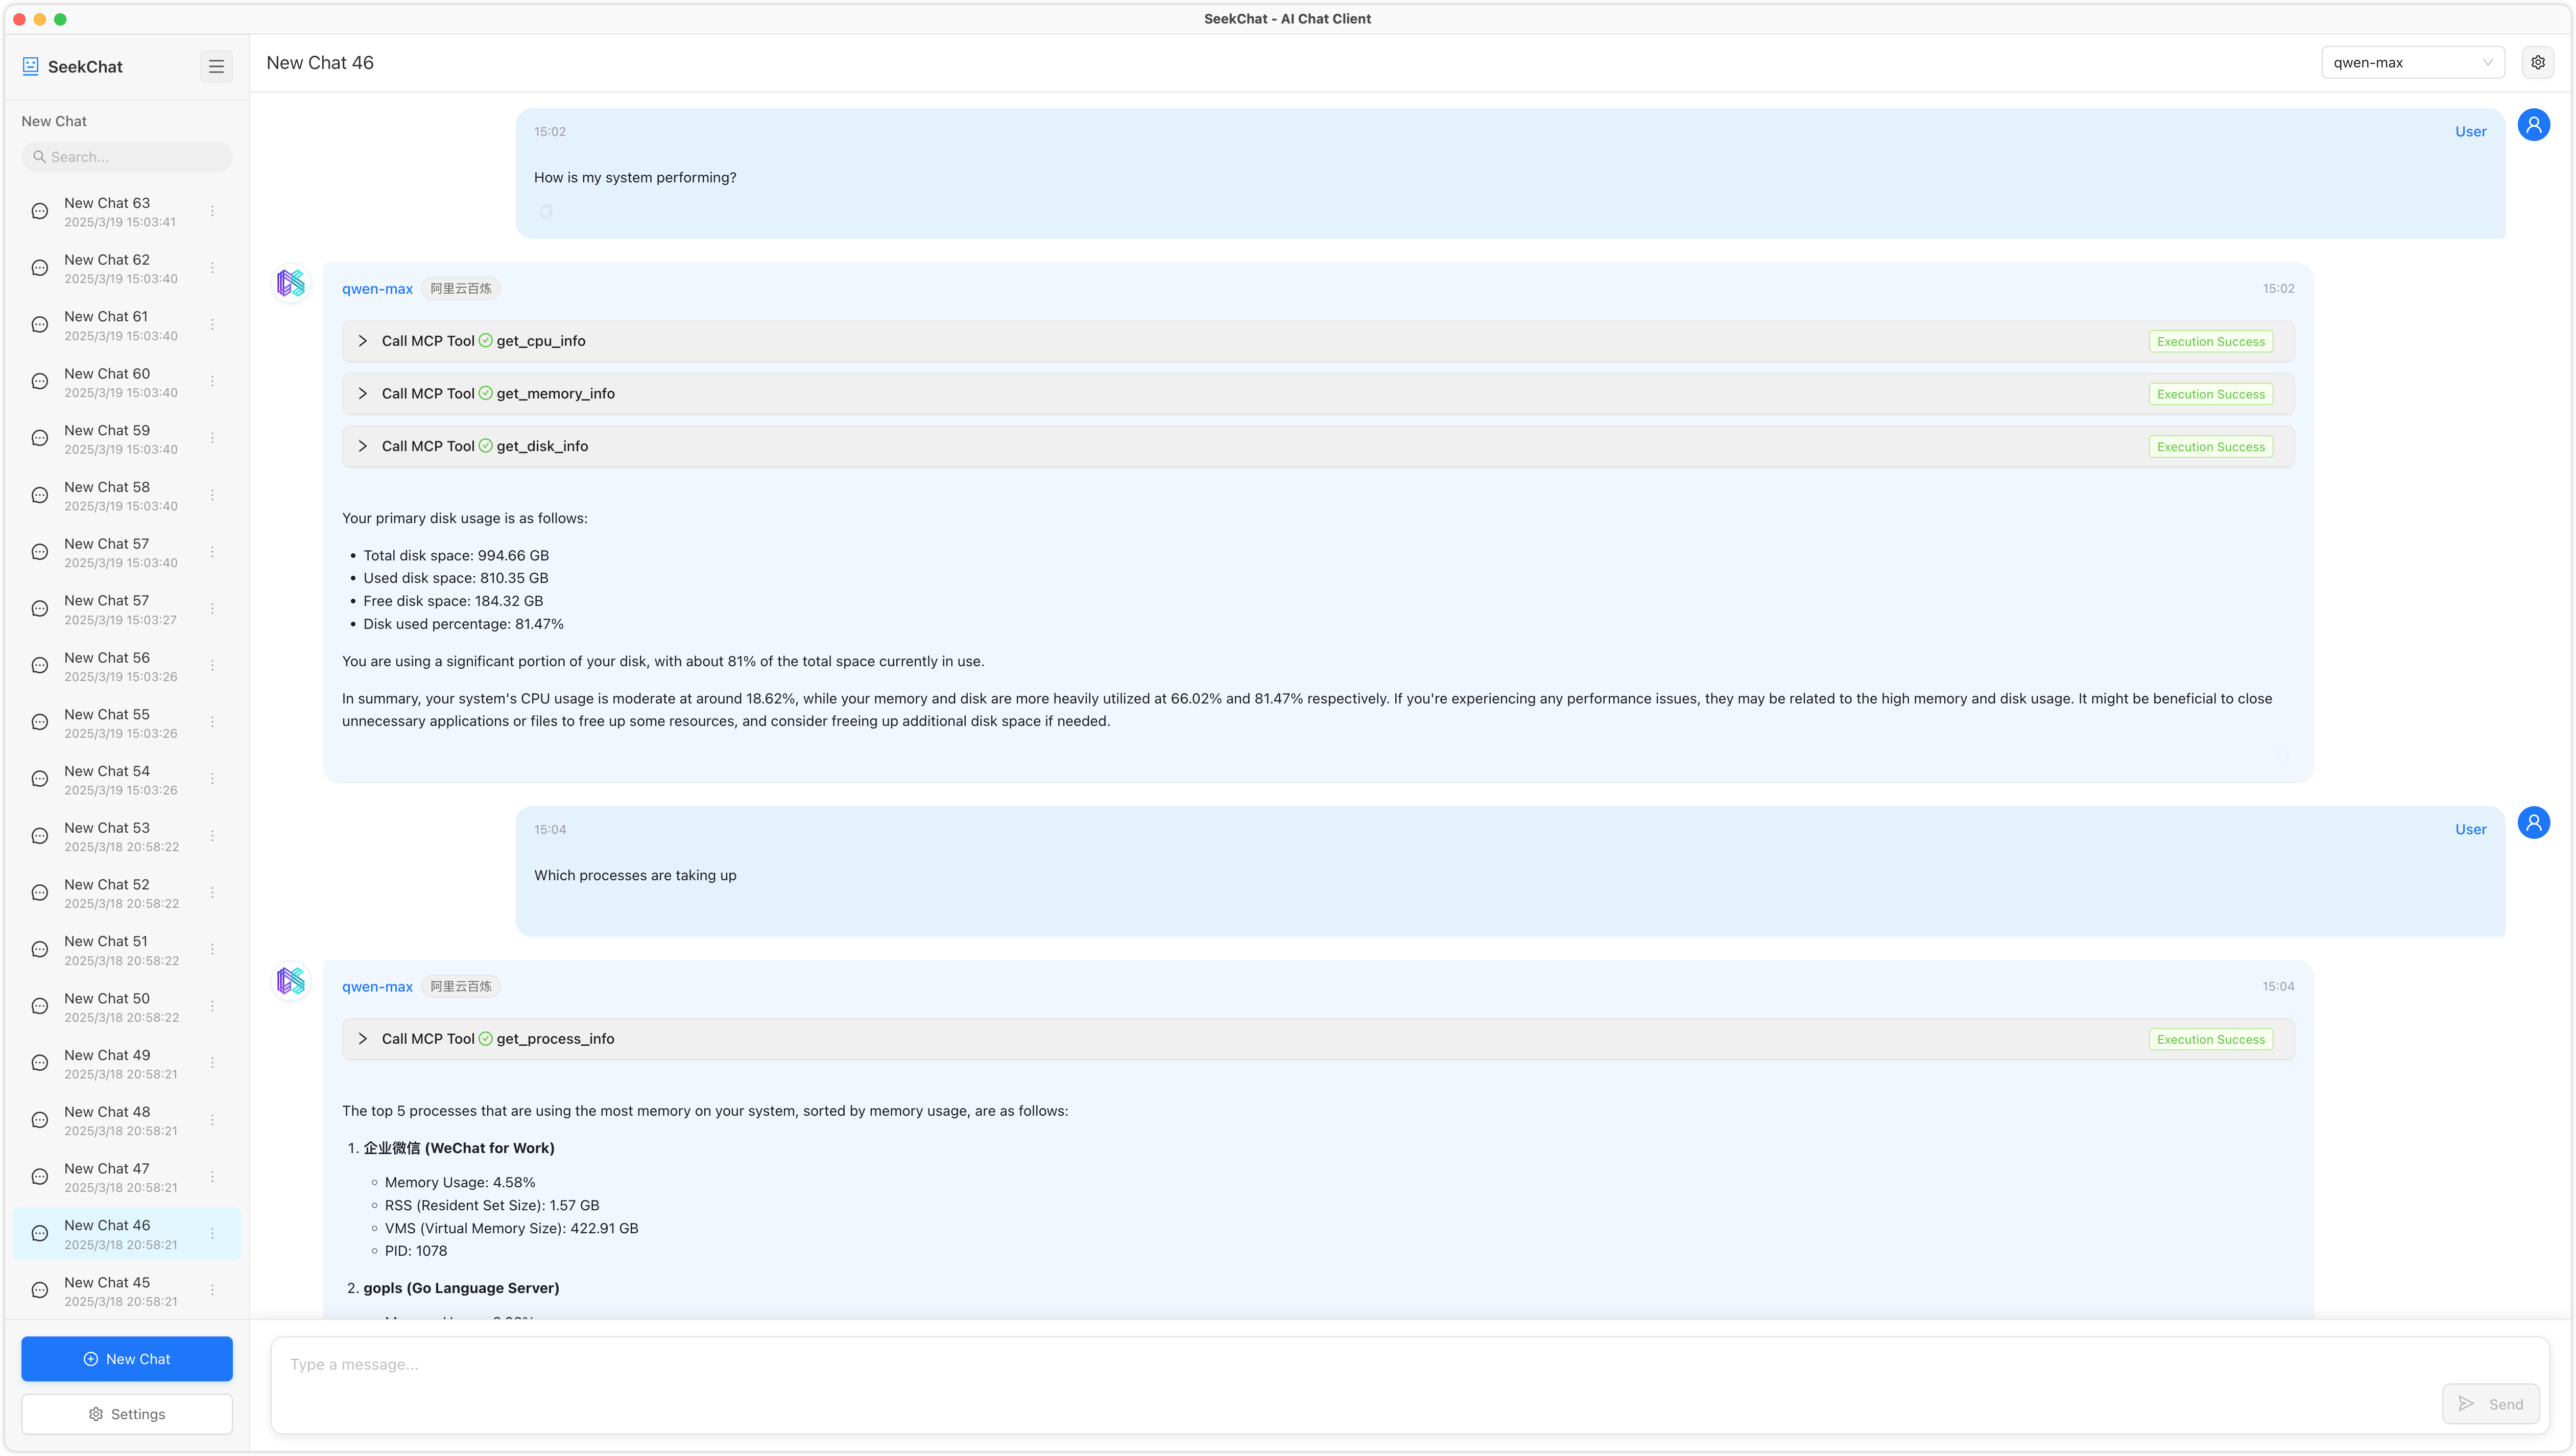
This tool provides the following monitoring capabilities:
Tool: get_cpu_info
Description: Get CPU information and usage
Parameters:
  - per_cpu (boolean, default: false): Whether to return data for each core
Tool: get_memory_info
Description: Get system memory usage information
Parameters: None
Tool: get_disk_info
Description: Get disk usage information
Parameters:
  - path (string, default: "/"): Specify the disk path to query
  - all_partitions (boolean, default: false): Whether to return information for all partitions
Tool: get_network_info
Description: Get network interface and traffic information
Parameters:
  - interface (string, optional): Specify the network interface name to query
Tool: get_host_info
Description: Get host system information
Parameters: None
Tool: get_process_info
Description: Get process information
Parameters:
  - pid (number, optional): Process ID to get detailed information for a specific process
  - limit (number, default: 10): Limit the number of processes returned
  - sort_by (string, default: "cpu"): Sort field (cpu, memory, pid, name)
git clone https://github.com/seekrays/mcp-monitor.git
cd mcp-monitor
make build
Run the compiled binary:
./mcp-monitor
The server starts in stdio mode, ready to communicate with an MCP-compatible LLM client.
Contributions are welcome! Please feel free to submit a Pull Request.
40+ tools for querying dashboards, alerts, datasources, and logs in Grafana
Run Claude Code as an MCP server so any agent can delegate coding tasks to it
 @microsoft✓ Official
Browser automation using accessibility snapshots instead of screenshots
 @googleapis✓ Official
Google's universal MCP server supporting PostgreSQL, MySQL, MongoDB, Redis, and 10+ databases
