

Are you the author? Sign in to claim
grep that returns ranked, token-budgeted code slices — built for LLMs and coding agents. CLI + Python library + MCP serv
grep that gives back ranked, token-budgeted code slices instead of whole files.
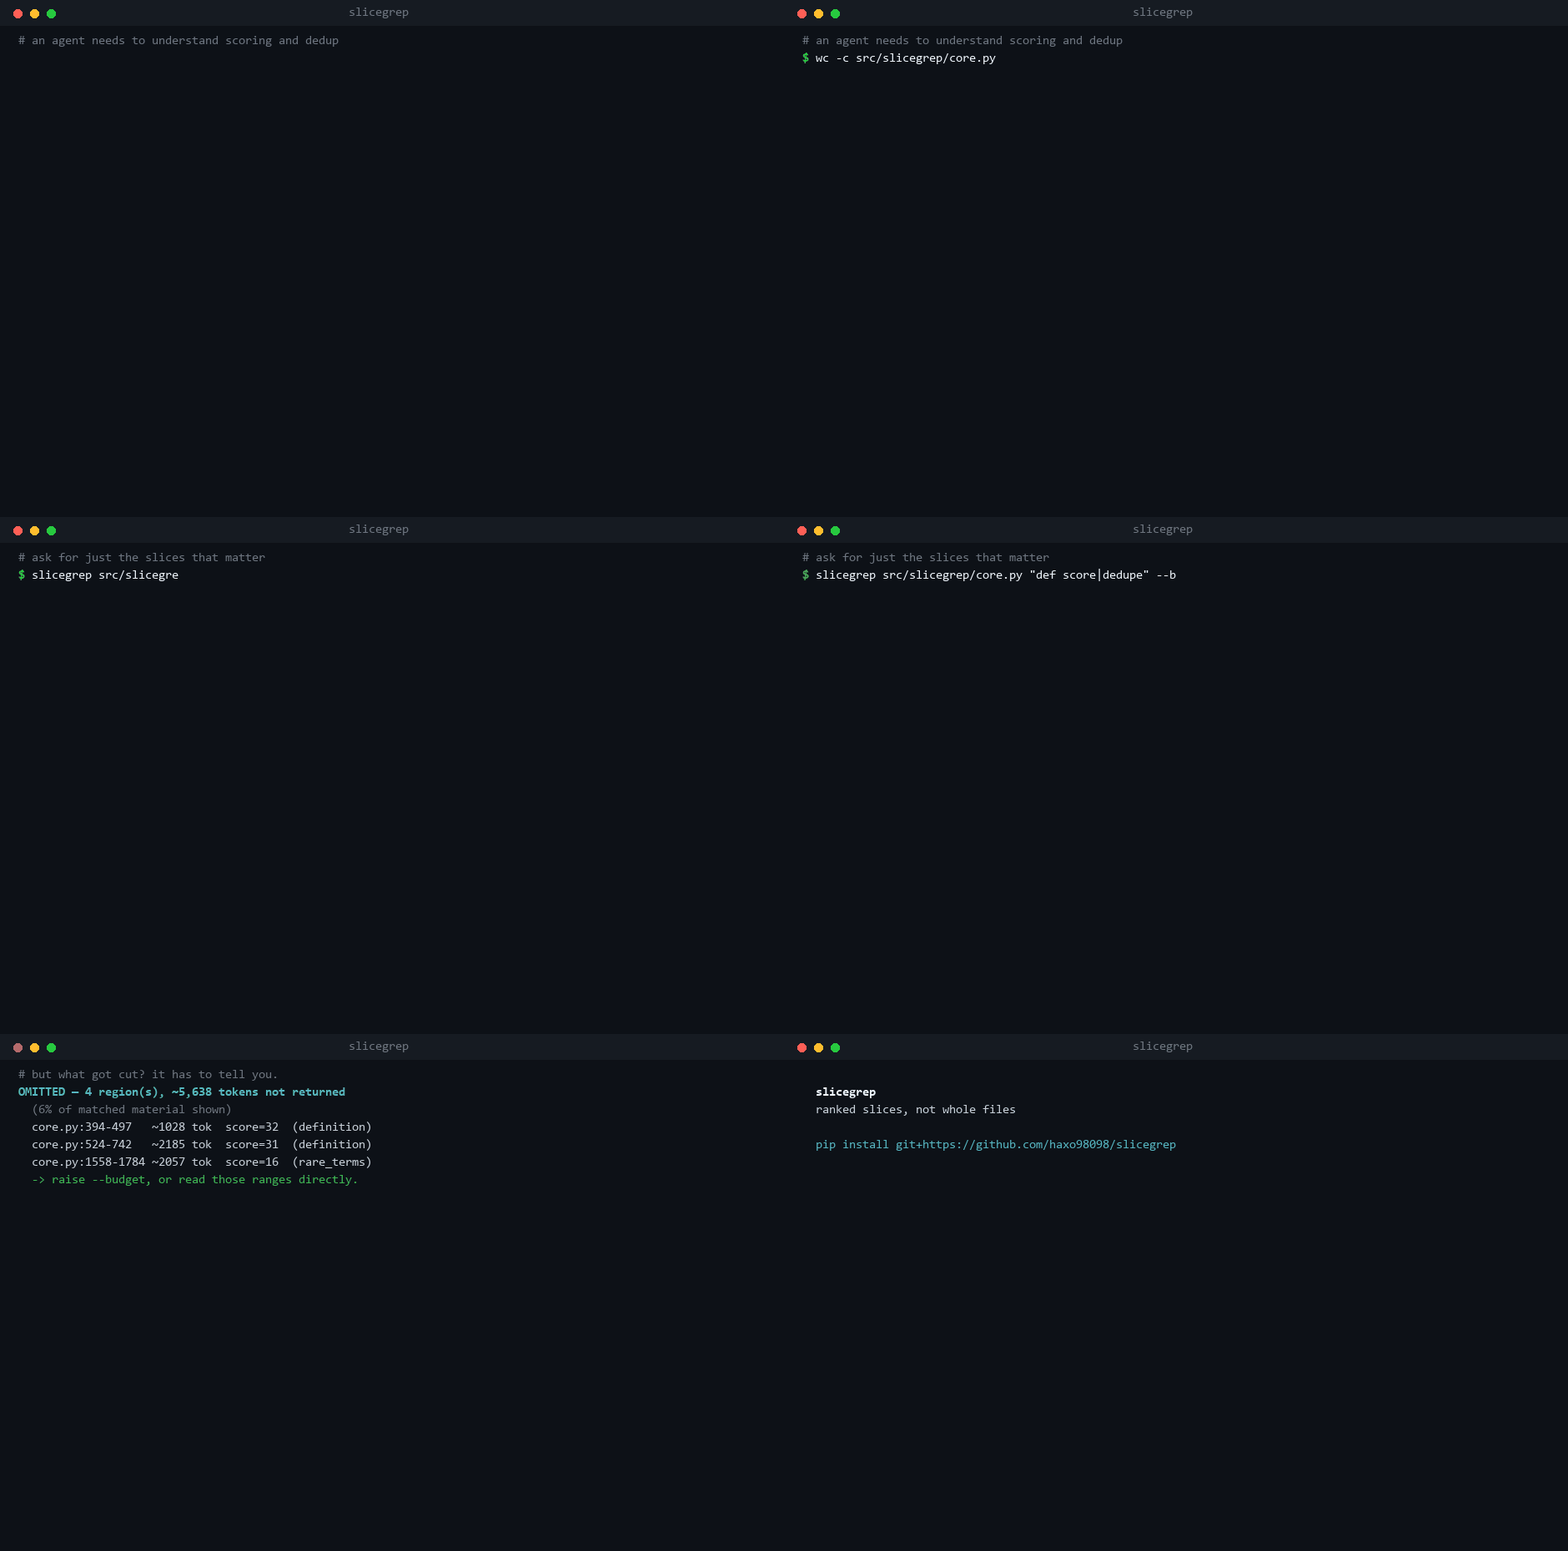
Longer demo covering directory ranking, plain-English queries, negative evidence, and the hook.
If you watch a coding agent work for ten minutes you'll see the same loop over and over. It greps, gets back a pile of line numbers with no context, opens three whole files to make sense of them, and then does it all again for the next question. Most of what ends up in the context window is code nobody asked about, and it doesn't leave. It just sits there crowding out the stuff that mattered.
grep gives you matches with no context. Opening the file gives you context plus a few thousand tokens of noise. I wanted the thing in between: the few slices that actually answer the question, best ones first, capped at a size I pick.
So that's what this is. Point it at a file or a directory, it pulls the relevant slices, ranks them, throws out near-duplicates, trims to a token budget, and tells you what it couldn't find.
pip install git+https://github.com/haxo98098/slicegrep
Core is standard library only. Python 3.8 and up.
Here's the thing I got wrong at first. Giving an agent a better tool isn't enough, because it has to remember to reach for it, and mostly it doesn't. It reaches for the plain file read out of habit.
So there's a plugin that takes the decision away. A hook sits in front of the Read tool, and when a read is big enough to be worth it, the whole file gets swapped out for a map of the file plus the slices matching whatever you're working on right now.
/plugin marketplace add haxo98098/slicegrep
/plugin install slicegrep@slicegrep
Nothing to install, it runs the bundled source. On this repo's own core.py
that's a 17,849 token read turned into 2,195 tokens of map plus slices.
I leave this running on my own machine, so it's built not to ruin my day:
It also corrects itself. A fixed budget is really just a guess about how dense a file is, and when the guess is wrong you get back a sliver. So the hook checks its own coverage, and if it returned less than 55% of what matched it doubles the budget and tries again, up to a ceiling. The ceiling matters. A hook that grows without limit is just a whole-file read wearing a hat.
Anything still missing comes back with the exact arguments to go get it:
STILL NOT SHOWN (38% of matched material above).
To see any of these, Read core.py with offset/limit:
  offset=394  limit=104   (~1028 tok, score=32)
  offset=524  limit=219   (~2185 tok, score=31)
So your next move is a precise ranged read, not re-reading the whole file.
Knobs: SLICEGREP_HOOK_MIN_TOKENS (2000), SLICEGREP_HOOK_BUDGET (1200),
SLICEGREP_HOOK_MIN_COVERAGE (0.55), SLICEGREP_HOOK_MAX_BUDGET (4000),
SLICEGREP_HOOK_TIMEOUT (5s), and SLICEGREP_HOOK_DISABLE=1 to switch it
off. If your Python isn't on PATH as python, edit the command in
hooks/hooks.json.
# find a function
slicegrep src/app.py "def handle_request"

# whole enclosing blocks, searched recursively, under a token budget
slicegrep src/ "Scorer|def score" --boundary fn --budget 800

# co-occurring concepts, a chunk matching more of them ranks higher
slicegrep . "retry|timeout|backoff" --budget 1500

# raw JSON for tooling
slicegrep src/ "TODO" 2 2 --json
fr is installed as a shorter alias, for focused read.
Plain English works too. "def score|budget" is fine, and so is
"how does budget packing guarantee definitions". Anything with three or
more content words gets expanded with stemming and subword matching, which is
what closes the vocabulary gap when you don't know the exact identifier.
From Python:
from slicegrep import focused_read

result = focused_read("src/", "class Scorer|def score", budget=800, boundary="fn")

print(result.render())          # the ranked text report an LLM reads
print(result.total_tokens)      # e.g. 612
for chunk in result.chunks:
    print(chunk.file, chunk.line_start, chunk.score, chunk.rank_reason)

data = result.to_dict()         # structured output for your own pipeline
Hit rate tables don't tell you what the difference feels like. So here's a single realistic bug hunt run both ways, scored on the three things you actually need to fix something: the definition, a caller in another file, and the test.
You can run this yourself. It takes two commands, and the first one checks out the exact upstream revisions these numbers came from:
python benchmarks/setup_corpora.py --only click,flask,requests
python benchmarks/compare_one.py --task echo
Each corpus is pinned to a full commit SHA, not just a tag, and the setup
script verifies what it actually checked out. If a maintainer has moved a tag
since, it says so loudly rather than quietly handing you numbers that can't
be compared to these. --corpora PATH or SLICEGREP_BENCH_CORPORA point it
at checkouts you already have.
"echo() mangles unicode on Windows. Where is it defined, who calls it, and what covers it?" (click)
| tool calls | tokens | definition | caller | test | |
|---|---|---|---|---|---|
| grep → read → read → grep | 4 | 14,233 | yes | yes | no |
| slicegrep | 1 | 2,614 | yes | yes | yes |
Same question, two other repos:
| task | baseline | slicegrep | saved |
|---|---|---|---|
url_for (flask) | 4 calls, 22,815 tok, all three | 1 call, 2,763 tok, all three | 88% |
Session.request (requests) | 4 calls, 8,826 tok, no test | 1 call, 2,710 tok, all three | 69% |
Two things jump out, and one of them isn't flattering:
The baseline keeps finding the definition and a caller and missing the test. That's not bad luck. Opening the two most promising grep hits gets you the implementation, and nothing in that loop ever goes looking for coverage. The budget packer reserves a slot for a test chunk, which is the only reason it lands one in a single call.
And the token gap is mostly just about whole files. The baseline pays full price for two files to use a few regions of each. That's the whole thesis, and it's also why the win shrinks on small files and grows on big ones.
Worth saying plainly: slicegrep is showing 4% to 36% of matched material in those runs. It gets the three things that matter because of the guarantees, not because it saw everything.
I got sick of retrieval projects reporting numbers from the same data they were tuned on, so this one holds data back. Tuning and validation seeds get burned during development, and anything published here comes from confirmation runs on untouched data with every previously used session excluded, against a frozen engine, run once. Two router bugs got caught that way, and the seeds they cost are written down in the CHANGELOG instead of quietly recycled.
Real-change retrieval, 286 fresh sessions. Real commits mined from click, flask, requests and rich. The repo gets rebuilt at the parent commit so no future information leaks in, the query is the commit message and nothing else, and a hit means pulling back at least half the regions the real fix touched under an 8k cap.
| strategy | hit rate | 95% CI | mean coverage |
|---|---|---|---|
| dense embeddings (potion-code) | 28.3% | [23.1, 33.5] | 25.0% |
| slicegrep | 26.6% | [21.5, 31.7] | 24.2% |
| tf-idf windows | 23.4% | [18.5, 28.3] | 21.6% |
| grep + file ranking | 23.4% | [18.5, 28.3] | 21.6% |
| ast-chunk tf-idf | 22.0% | [17.2, 26.8] | 20.5% |
| bm25 windows | 21.7% | [16.9, 26.5] | 20.2% |
That's a statistical tie for first, not a win, and I'd rather say so than round it in my favour. Both are clear of everything else. slicegrep is the only one up there that also hands back line-attributed slices, negative evidence, and guaranteed definition plus caller plus test, and it's the one that wins the suite below.
Controlled retrieval suite, fresh seed, 240 tasks. Six task families (symbol lookup, docstring concepts, cross-file call chains, bug localization from error strings, config data flow, test plus implementation) against twelve strategies.
| strategy | tokens to model | hit rate | tool calls |
|---|---|---|---|
| slicegrep | 2,304 | 71.4% | 1 |
| bm25 windows | 2,213 | 66.1% | 1 |
| ast-chunk tf-idf | 2,296 | 58.6% | 1 |
| grep + window reads | 5,693 | 60.4% | 7 |
| semble (embeddings+BM25) | 2,094 | 44.5% | 1 |
| dense embeddings | 2,262 | 35.2% | 1 |
First by 5.3 points, at about 2.3k tokens and one call.
The other suites are in the RESULTS files: cross-language (zod 77.5% against a next-best 60.0, serde 67.5% against 50.0, django at ~2,800 files still first at 60.0), multi-turn, and an end-to-end run with real model calls where it had the best mean file recall.
Precise queries (identifiers, error strings, one or two terms) go down the lexical path: BM25 over definition-aligned blocks, the guaranteed objectives, and diversity packing so one file can't hog the budget. Dense retrieval is gated out of that path completely, because measuring it showed it waters down precise packing. Vague queries keep the guarantees and then fill whatever budget is left using a fused dense and BM25 ranking.
What pushes a slice up: matching several of your patterns, holding distinctive identifiers instead of boilerplate, being where a symbol is defined rather than just used, having several hits in one place. What pushes it down: declaration-only matches, test files (unless you went looking for tests), vendored or generated paths, and slices that are mostly comments.
The optional extras (model2vec for the dense stage, git history priors) drop out quietly when they aren't around, which is what keeps the core free of dependencies.
This is the obvious objection to anything that hands back 350 tokens where there were 18,000, and "trust the ranking" isn't an answer. So nothing is allowed to vanish quietly. Every region that matched your query either comes back, or gets named in the report with where it is, how big it is, what it scored, and why it lost:
OMITTED — 12 matching region(s), ~8610 tokens not returned (6% of matched material shown):
  core.py:102-192  ~925 tok  score=47.0  (multi_match(3), co_occurrence, all_patterns)
  cli.py:1-60      ~642 tok  score=41.0  (multi_match(3), co_occurrence)
  hook.py:219-235  ~127 tok  score=13    (semantic-recall)
  ... and 4 more
  -> raise --budget, or read these ranges directly.
Three things come out of that.
Coverage is stated instead of implied. "6% of matched material shown" is the honest reading of a 700-token budget against that query. If that's too low for what you're doing, raise the budget. What it won't do is pretend the other 94% didn't exist.
You can always go get it. Omissions carry exact line ranges, so the next step is a normal read of those lines rather than a fishing trip.
Truncation counts as loss too. When one region is bigger than the entire budget it gets cut to fit, and the header used to keep claiming the full line range while showing part of it. It now reports only the range it actually returned and lists the rest as omitted. That was a genuine bug, and I found it while writing the test for this section.
result.coverage, result.omitted and result.omitted_tokens are on the
Python object and in --json, so a harness can act on them instead of
guessing: raise the budget and retry, or go fetch the omitted ranges.
Most search tools give you nothing back and leave you wondering whether the thing doesn't exist or you just missed it. This one tells you which:
NEGATIVE EVIDENCE:
  - No definition found for 'Scorer' in src/
  - Pattern 'deprecated_api' not found in src/
It also separates "not in the file" from "in the file but it fell outside the budget", which is what you need to know when you're deciding whether to raise the budget or change the query.
If you'd rather the model called it as a tool:
pip install "slicegrep[mcp] @ git+https://github.com/haxo98098/slicegrep"
claude mcp add slicegrep -- slicegrep-mcp
Or in an MCP config file:
{
  "mcpServers": {
    "slicegrep": {
      "command": "slicegrep-mcp"
    }
  }
}
Works with Claude Desktop, Claude Code, Cursor, Windsurf, or anything else that speaks MCP. Needs Python 3.10 or newer.
Both of these were real, both are fixed, and both are worth knowing about because they'll bite any regex-based retrieval tool.
Catastrophic backtracking. A pattern with a nested quantifier like
(a+)+$ sends Python's regex engine into exponential backtracking. I
measured 197 seconds of CPU against a single 200-character line, and it was
still going when I killed it, because re has no timeout and simply never
comes back. Patterns get screened now. A query made only of those raises
immediately and tells you how to rewrite it, and a bad fragment inside a
bigger query degrades to a literal so the rest still works. Lines over 5,000
characters, which in practice means minified bundles, get skipped instead of
matched.
The dense model reaching for the network. Loading it can fetch from
HuggingFace on a cold cache. A refused connection raises an error, but a
stalled one just sits there, and from the outside that's indistinguishable
from a frozen search. It's bounded now by SLICEGREP_DENSE_TIMEOUT (15s) and
falls back to lexical only.
If you want speed, SLICEGREP_DENSE=off takes about 2.7s off a cold
directory search on a mid-size repo. A cold run over a 770-file tree is
roughly 7s, while warm calls are 35 to 60ms thanks to the in-process cache,
so a long-running MCP server pays that once rather than every query.
slicegrep <path> <pattern> [before] [after] [options]

  <path>       file OR directory (a directory implies a recursive walk)
  <pattern>    case-insensitive regex; join alternatives with '|'
  before after context lines each side of a match (default 40 40)

options:
  --budget N        keep only the highest-ranked chunks fitting ~N tokens
  --boundary MODE   auto (fixed window) | fn (snap to enclosing function/class) | none
  --recursive, -r   force a directory walk even for a file path
  --no-dedupe       keep near-duplicate chunks (exact dups still collapse)
  --json            print raw JSON instead of the rendered report
  --version
Exit code is 0 when something matched and 1 when nothing did, so scripts and CI can branch on it.
git clone https://github.com/haxo98098/slicegrep
cd slicegrep
pip install -e ".[dev,mcp]"
pytest
To reproduce any of the benchmark numbers, fetch the pinned corpora first:
python benchmarks/setup_corpora.py            # snapshots at pinned SHAs
python benchmarks/setup_corpora.py --full     # + full history, needed by bench3
python benchmarks/setup_corpora.py --verify   # check what you have
The corpora are other people's repositories, so they're cloned on demand and never committed here.
The CHANGELOG records the experiments that failed next to the ones that worked. Multiplicative history priors, adaptive budget splits, RRF packing and a few others all lost to what's here, and it seemed worth keeping track of what didn't pan out.
Run Claude Code as an MCP server so any agent can delegate coding tasks to it
 @microsoft✓ Official
Browser automation using accessibility snapshots instead of screenshots
 @googleapis✓ Official
Google's universal MCP server supporting PostgreSQL, MySQL, MongoDB, Redis, and 10+ databases
 @github✓ Official
Official GitHub integration for repos, issues, PRs, and CI/CD workflows