

Are you the author? Sign in to claim
TDA - Thread Dump Analyzer (for Java). Analyze your Thread Dumps with a GUI or use it as MCP Server.
![]()
![]()

[!IMPORTANT]
2026-05-11 - TDA 3.2 available.
- VisualVM Plugin: proper integration in VisualVM working again.
- UI: Updated jsvg version to 2.1.0.
2026-04-18 - TDA 3.1 available.
- VisualVM Plugin: proper integration in VisualVM working again.
- Logfile Parsing: Support for UTF16 files.
- UI: some small fixes.
2026-01-30 - TDA 3.0 is now available! 🚀 This major release brings significant enhancements:
- Extended MCP Server: Now with Carrier Thread Pinning detection and support for SMR (Safe Memory Relocation) parsing.
- Modernized UI: Completely refreshed look and feel using FlatLaf.
- Usability Improvements: Fixed several long-standing issues, including improved split-pane management and faster parsing.
- Native macOS Support: Now providing a dedicated macOS binary.
- Logging: Especially for troubleshooting in MCP Mode.
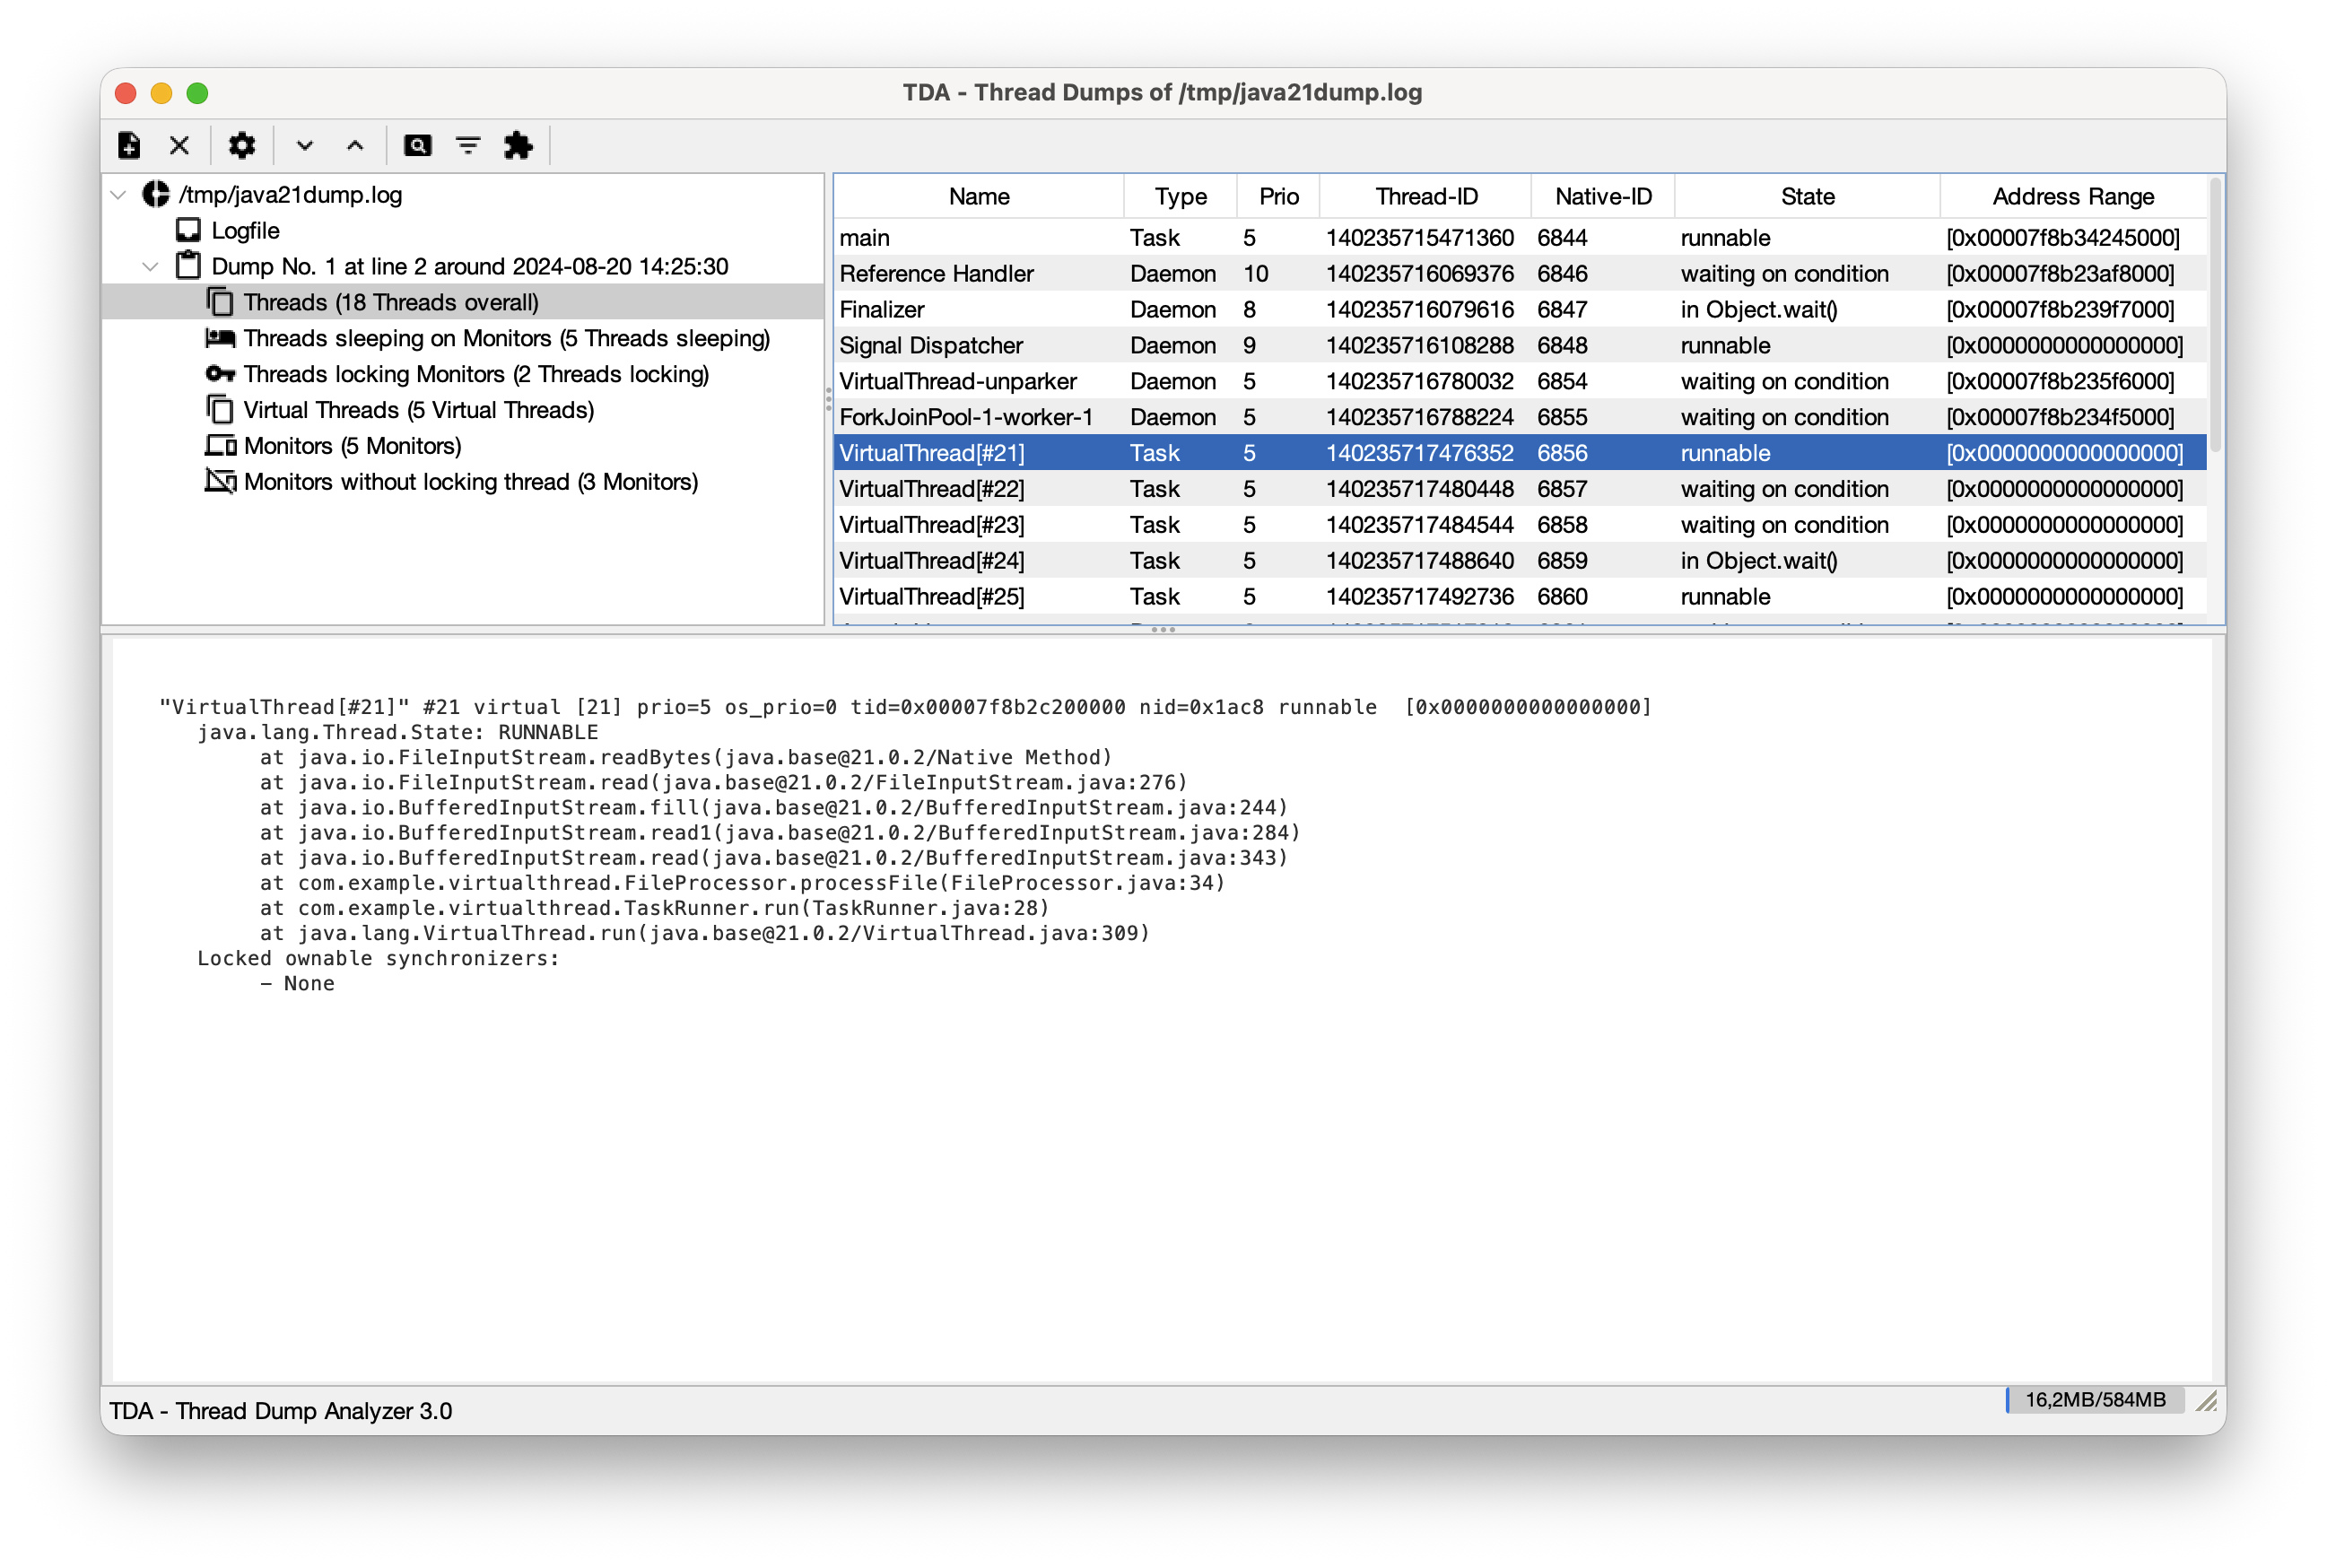
TDA (Thread Dump Analyzer) for Java is a powerful yet lightweight Swing GUI and MCP Server for analyzing Thread Dumps and Heap Information generated by the Java VM. It is designed to assist in diagnosing performance issues, deadlocks, and memory problems in Java applications. With its MCP capabilities, TDA can be seamlessly integrated into AI-powered development workflows.
TDA supports Java 1.4.x through Java 21+, including specialized support for Virtual Threads (Java 19+) and JSON-based thread dumps (Java 21+, experimental).
jcmd <pid> Thread.dump_to_file -format=json <file>.
Note: JSON dumps currently provide basic information (name, tid, stack trace) but lack details like thread states or native IDs. For comprehensive analysis, textual dumps are recommended.-XX:+PrintClassHistogram).TDA can be installed or used in several ways:
The simplest way to use TDA is to download the tda.jar from the Releases page. Since it's a self-contained JAR, you can run it directly on any system with Java installed.
TDA is available as a plugin for VisualVM. You can install it directly from the VisualVM Plugin Center (Tools -> Plugins). This integrates TDA's analysis capabilities directly into your VisualVM environment. The last available version in the plugin center is 2.4. For installing the recent version, download the three nbm files from the Releases page and install them manually in the VisualVM plugins settings.
TDA provides a native macOS DMG package for easier installation. This package includes its own Java runtime, so no separate Java installation is required to run it.
Since the DMG is currently unsigned, macOS will block it by default with a warning that the "developer cannot be verified". To install and run TDA:
TDA-<version>.dmg from the Releases page.TDA.app in your Applications folder and select Open.If this fails, you might need to confirm the installation from the system settings. For this just follow the instructions after clicking on the '?' Icon on the upper right corner of the error dialog.
TDA can be used in four different ways to suit your environment:
The most common way to use TDA for offline analysis of production log files. (See Installation for how to get the JAR).
How to run:
java -Xmx512m -jar tda.jar
Once opened, you can add log files containing thread dumps. TDA will parse them and display them in the tree view. If you
have several or big log files, you might need to adjust the memory allocation by increasing the -Xmx flag.
Analyze a running application directly within JConsole. This is particularly useful for production environments where you need to quickly inspect the state of a live system. The plugin is part of the standalone jar, which needs to be downloaded for this.
How to use: Start JConsole with the TDA plugin:
jconsole -pluginpath tda.jar
A new "Thread Dumps" tab will appear. From here, you can:
TDA is also available as a plugin for VisualVM. You can install it directly from the VisualVM Plugin Center. It provides the same powerful analysis tools integrated into your VisualVM workflow. (See Installation for details).
Newer JDK versions allow generating thread dumps in JSON format using:
jcmd <pid> Thread.dump_to_file -format=json <file>
TDA can parse these files, but please note that the information provided in the JSON format is currently more basic than the traditional textual output. For example, it often lacks detailed thread states (like MONITOR_WAIT vs WAITING) or native thread IDs (nid).
Recommendation: For in-depth analysis of deadlocks, monitor contention, or specific thread states, the textual thread dump format is still preferred.
For integration with AI tools (like Cursor, Junie, or Claude Desktop) or automated pipelines, TDA can run as a Model Context Protocol (MCP) server. This allows for headless analysis of thread dumps using AI assistance. You need to download the standalone jar for this.
There's also an articel on dev.to about how to use TDA as an MCP server.
java -Djava.awt.headless=true -jar tda.jar --mcp
{
  "mcpServers": {
    "tda": {
      "command": "java",
      "args": ["-Djava.awt.headless=true", "-jar", "path/to/tda.jar", "--mcp"]
    }
  }
}
The MCP server exposes the following tools:
| Tool | Arguments | Description |
|---|---|---|
parse_log | path (string, required) | Parses a log file containing Java thread dumps. This must be the first action for a log file. |
get_summary | None | Returns a summary of all parsed thread dumps (index, name, timestamp, thread/deadlock counts). |
check_deadlocks | None | Checks for and returns information about any deadlocks detected in the parsed thread dumps. |
find_long_running | None | Identifies threads that remain in the same state/stack trace across consecutive dumps. |
analyze_virtual_threads | None | Detects virtual threads where the carrier thread is stuck in application code. |
get_native_threads | dump_index (int, required) | Returns a list of all threads in a native method for a specific thread dump. |
get_zombie_threads | None | Returns a list of zombie threads (unresolved SMR addresses) with timestamps and dump names. |
clear | None | Resets the server state and clears the internal thread store for a new log file. |
To ensure that AI agents use TDA efficiently and don't attempt to read large log files directly (which is slow and expensive), you should configure a System Prompt.
Instead of project-wise rules, you can configure these instructions globally:
~/.junie/instructions.md and add the recommended system prompt.If you prefer project-specific rules:
.cursorrules file in the project root..junie/instructions.md file in the project root.When you encounter a log file that appears to contain Java thread dumps:
1. DO NOT try to read or "cat" the entire file if it's large.
2. Use the `tda-analyzer` MCP toolset.
3. First, call `parse_log(path="...")` to initialize the analysis.
4. Use `get_summary()`, `check_deadlocks()`, `find_long_running()`, `analyze_virtual_threads()`, `get_native_threads()`, and `get_zombie_threads()` to perform the analysis.
5. Provide your insights based on the structured data returned by these tools rather than the raw log text.
This configuration makes the analysis much faster and significantly reduces token usage.
TDA is built using Maven. It requires Java 11 or higher to build and run.
mvn clean package
This will build all components:
tda/target/tda-x.x.jar).target/ directory of each visualvm-* module).To build the macOS DMG package, use the release profile (requires macOS and JDK 17+):
mvn clean package -Prelease
The resulting standalone JAR will also be located in the tda/target/ directory.
If you encounter issues while using TDA, check the following sections for guidance.
TDA maintains a centralized log file to help diagnose issues. If something isn't working as expected, the log file is the first place to look.
~/Library/Logs/TDA/tda.log%LOCALAPPDATA%\TDA\Logs\tda.log~/.tda/logs/tda.logIn standalone or plugin mode, TDA will display a red dot in the status bar (next to the memory indicator) if a critical error has occurred. Hover over the dot to see a tooltip reminding you to check the log file.
Running TDA as a headless MCP server has specific requirements:
-Djava.awt.headless=true when running the JAR. TDA is a Swing-based application, and the MCP mode must bypass UI initialization.stdin and stdout. Avoid using any commands or scripts that print additional information to stdout, as this will corrupt the JSON-RPC stream and cause the AI client to lose connection.parse_log, always use absolute paths for the log file. The working directory of the MCP server might not be what you expect depending on how your AI client (e.g., Claude Desktop) launches it.Thread dumps from large production systems can be hundreds of megabytes.
-Xmx flag:
java -Xmx2g -jar tda.jar
TDA is licensed under the Lesser GNU General Public License (LGPL).
For more detailed information, please refer to the source code. The wiki has been removed because it was outdated.
Run Claude Code as an MCP server so any agent can delegate coding tasks to it
Browser automation using accessibility snapshots instead of screenshots
Google's universal MCP server supporting PostgreSQL, MySQL, MongoDB, Redis, and 10+ databases
Official GitHub integration for repos, issues, PRs, and CI/CD workflows
